The Effect of Various Factors on Variability of Retinal Nerve Fiber Layer Thickness Measurements Using Optical Coherence Tomography
Article information
Abstract
Purpose
To evaluate the effects of various factors on the variability of retinal nerve fiber layer (RNFL) thickness measurements using the Stratus optical coherence tomography (OCT) in normal and glaucomatous eyes.
Methods
Four hundred seventy-four subjects (103 normal eyes and 371 glaucomatous eyes) were scanned to determine the RNFL thickness measurements using the Stratus OCT. Measurements were obtained twice during the same day. The standard deviation (SD) was used to compare the variability in RNFL thickness measurements of the normal subjects to that of the glaucomatous patients. Multivariate regression analysis was used to evaluate which covariates were independent predictors of SD in overall mean RNFL thickness.
Results
The mean SD of all RNFL thickness measurements was larger in the glaucoma group except in one sector. In the multivariate regression analysis, the average signal strength (SS) and the relative SS change (difference in SS between initial and repeat scans, divided by initial SS) were independent predictors of the SD in the RNFL thickness measurements (partial R2 = 0.018, 0.013; p = 0.016, 0.040, respectively).
Conclusions
Glaucomatous eyes tend to be more variable than normal eyes in RNFL thickness measurement using the Straus OCT. The average SS and the relative SS changes appear to correlate with the variability in RNFL thickness measurement. Therefore, the results of the RNFL analysis should not be interpreted independently of these factors.
Glaucoma, an optic neuropathy associated with the progressive loss of retinal ganglion cells, results in the irreversible thinning of the retinal nerve fiber layer (RNFL) [1,2]. Previous studies support the idea that damage to the optic nerve and the nerve fiber layer can often be identified before alterations in the visual field are detected [3-5]. Autopsy studies have shown that 30% to 50% of the retinal ganglion cells may be lost before an abnormality appears on standard achromatic perimetry [6,7]. Clinical examination and red-free photography are limited in their ability to quantify subtle changes in the RNFL over time. A reliable method to accurately measure RNFL thickness would be helpful in identifying early glaucomatous changes. This early detection would allow discrimination of normal and abnormal RNFL thicknesses. With the use of optical imaging techniques, the assessment of RNFL became more objective and quantitative.
Optical coherence tomography (OCT), first described by Huang et al. [8], offers a high resolution cross-sectional imaging technique that allows for the in vivo measurement of RNFL thickness. After improving the capabilities of this instrument, refinements have been incorporated into the third generation version, named the Stratus OCT (Carl Zeiss Meditec, Dublin, CA, USA). The Stratus OCT is able to quantify the thickness of the RNFL at a resolution of approximately 8 to 10 µm. Studies evaluating the reproducibility of the Stratus OCT have shown that this imaging technique obtains measurements with a high degree of reproducibility [9-12]. Budenz et al. [9] reported that sameday RNFL thickness measurements had a test-retest variability, calculated as two times the standard deviation (SD), that ranged from 3.5 to 4.7 µm in normal eyes and 5.2 to 6.6 µm in glaucomatous eyes. Budenz et al. [10] also concluded that, when comparing two mean RNFL values obtained on different days in the same eye, an 8 µm decrease in thickness might be accepted as within normal limits of test-retest variability with 95% tolerance.
Although most of these studies reported good measurement reproducibility, there were factors that are likely to affect the variability of the RNFL thickness measurements using the Stratus OCT. These factors include RNFL thickness, refractive error (RE), axial length (AL), presence of a visual field defect, age, and signal strength (SS). The effects of such factors on the reliability of measurements should be taken into consideration when designing methods for detecting progressive changes in patients with glaucoma.
The purpose of this investigation was to evaluate the effects of various factors on the variability of RNFL thickness measurements using the Stratus OCT in normal and glaucomatous eyes.
Materials and Methods
This study was performed in adherence with the Declaration of Helsinki and after approval from the Institutional Review Board and the ethics committee of Kangbuk Samsung Hospital in Seoul, Korea. Subjects were recruited from the outpatient glaucoma service of the Department of Ophthalmology, Kangbuk Samsung Hospital. This prospective study looked at 658 eyes in 658 participants. All subjects gave their consent prior to inclusion in the study.
All subjects underwent not only a full medical and ocular history, but also a detailed ocular examination, including visual acuity. The intraocular pressure measurement was obtained using the Goldman applanation tonometer. Slit lamp and fundus examinations were also performed. Perimetry was performed by experienced technicians using the Humphrey Visual Field Analyzer (Carl Zeiss Meditec) using the 30-2 SITA Standard algorithm. The AL was measured with the IOLMaster (Carl Zeiss Meditec). The RE was the spherical equivalent measured with an auto ref-keratometer (RK-F1; Canon, Tokyo, Japan).
Normal participants were included if their bilateral highest documented intraocular pressure (IOP) was 22 mmHg. Bilateral normal eye examination findings, including dilated fundus examination, and bilateral normal visual field results were also noted. The normal visual field results were defined as a pattern standard deviation (PSD) within the 95% normal limits, and a glaucoma hemifield test (GHT) resulted as "within normal limits" or "abnormally high sensitivity." Subjects with glaucoma included those with diagnoses of any form of glaucoma, defined as optic disc abnormalities consistent with glaucomatous optic neuropathy with or without visual field loss. Glaucomatous optic disc abnormality was defined as neuroretinal rim thinning, notching, excavation, or an RNFL defect. Glaucomatous visual field loss was defined as PSD outside the 95% normal limits or GHT results other than "within normal limits" or "abnormally high sensitivity," confirmed with a second visual field test. Only patients with IOPs that were controlled and deemed stable were included in this study. The other inclusion criteria for both normal and glaucomatous subjects were 1) 18 years of age or older, 2) best-corrected visual acuity of 20 / 40 or better, 3) pupil diameter ≥2 mm, 4) no history of ocular or neurologic disease or surgery that might produce test results or vision changes that could confound recognition of a test result due solely to glaucoma, 5) no history of amblyopia, 6) mental and physical capacity to perform the tests and 7) willingness to participate as a subject in the study.
Optical coherence tomography technique
Subjects were scanned twice in the same day with the Stratus OCT (Carl Zeiss Meditec), with short breaks between each measurement. A single technician performed the OCT scan through the patient's dilated pupil. While seated, each subject was instructed to place his/her chin on the chin rest and to fixate the eye being measured on a target. This maneuver brought the optic nerve head within view of the examiner. To ensure a smooth optical surface, the technician applied artificial tears (Hyalein; Santen Pharmaceuticals, Osaka, Japan) before the OCT scan. Before the scan was obtained, the polarization and Z-offset, as determined from the OCT settings, were optimized to assure the best possible scanning quality.
Fast RNFL thickness protocols were performed using internal fixation during scanning. The fast scan consists of three successive circular subscans around the disc with A scan measurements at 256 locations per revolution over a total of 1.92 seconds. Although these three scans can be examined separately for research or quality control purposes, they are generally simply averaged to report the thicknesses as a combined set of 768 A-scans in a circle of 3.4-mm diameter around the disc.
A scan was saved only if the fundus image was sufficiently visible to distinguish the optic disc and the scanning circle and if there were no obvious movement artifacts with missing data at the acquired scan pattern. Images with eye movements during scans, poor centration, poor focus, low analysis confidence or signal strength less than 6 / 10 were excluded. For subjects who had both eyes scanned, one eye was randomly chosen for analysis.
The RNFL analysis used an automated computer algorithm to identify the anterior and posterior margins of the band of reflectance representing the RNFL. The margins were marked with two white lines in the visual display. The distance between the margins comprised the RNFL thickness. The analysis algorithm reported 17 RNFL thickness values: the mean RNFL thickness around the entire circumference, the average thickness within each of the four quadrants (temporal, superior, nasal, and inferior), and the average thickness in each of 12 angular sectors (30° interval). The angular sectors were situated so 0° represented the temporal horizontal line and 90° represented the superior vertical line.
Statistical methods
The methods employed to determine the reproducibility of RNFL thickness were SD. The SD is a measure of the variability of a data set, or a probability distribution. Each patient's SD values were based on multiple measures (two times) of RNFL thickness. A low SD indicates that the data points tend to be very close to the same value, while high SD indicates that the data are 'spread out' over a large range of values. The within subjects SD as an index of measurement error, as it has a more direct interpretation which can be applied to individual measurements [13].
The SD was used in this study to compare the variability in RNFL thickness measurements of normal subjects with that of glaucomatous patients. The ratio of SD (glaucoma/control) in overall mean RNFL thickness and quadrant analysis were obtained. The Student's t-test was performed to estimate the significance difference in overall mean RNFL thickness between the glaucoma group and the normal group.
Multivariate regression analysis was used to test whether the RNFL thickness measurements, mean deviation (MD), and PSD in Humphrey Visual Field Analyzer were independent predictors of SD for overall mean RNFL thickness. Other factors evaluated as independent predictors of SD included RE, AL, age, average SS, and relative SS change (difference in SS between initial and repeat scans divided by initial SS). As various factors interfered with one other in univariate analysis, correlations between variability in RNFL thickness measurements and the various factors might not be precise. Multivariate analysis may help to identify the underlying relationships among sets of variables. Univariate analysis did not demonstrate significant correlation of some factors with SD in the RNFL thickness measurements, but these parameters were included in the multivariate regression analyses. Data were analyzed using statistical software SPSS ver. 15.0 (SPSS Inc., Chicago, IL, USA).
Results
Six hundred fifty-eight subjects were initially enrolled in the study. Twenty-five normal subjects (19.5%) and 159 glaucomatous subjects (30.0%) were excluded because of poor analysis quality (SS <6 or low analysis confidence) in one of the measurements. Four hundred seventy-four subjects (103 normal subjects and 371 glaucomatous patients) were analyzed. Participant demographic and ophthalmic characteristics are shown in Table 1. The glaucoma group had poorer visual field defects (MD and PSD), longer AL, and lower average SS than the normal group.
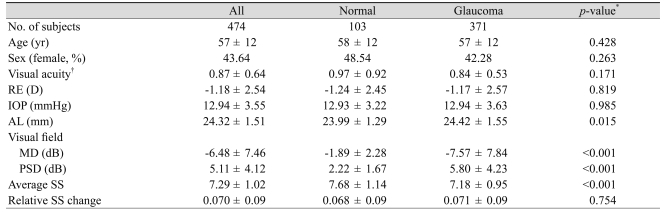
Participant demographic and ophthalmic characteristics
The SD of all 474 subjects is presented in Table 2 without discriminating between the normal and glaucomatous subjects. Table 3 shows the SD values for the normal and glaucomatous eyes separately. The variability depended on the size of the area included in the measurement. Specifically, the SD was smaller in the mean RNFL thickness measurement than in quadrants analysis. Also, it was smaller in quadrant analysis than in the 30° angular sector analysis (Tables 2 and 3).

Mean SD of all 474 subjects
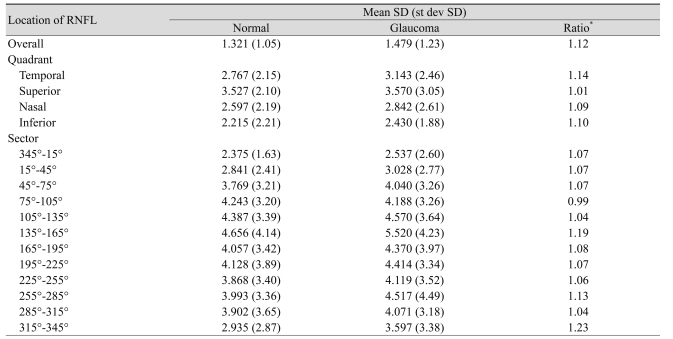
Mean SD of normal and glaucomatous subjects
The mean SD of all RNFL thickness measurements except in one sector was larger in the glaucoma group (Table 3). The ratio of mean SD in overall mean RNFL thickness for the glaucoma group to the normal group was 1.12. However, there was no statistically significant difference of mean SD in overall mean RNFL thickness for the normal group and the glaucoma group (p = 0.19).
Multivariate regression analysis was performed using overall RNFL thickness, RE, AL, MD, PSD, age, average SS, and relative SS change as independent variables and SD in RNFL thickness as the dependent variable (Table 4). In Fig. 1, the SD in the overall mean RNFL thickness measurements was plotted against the various factors for all subjects. The average SS is the most predictive parameter (highest partial R2) for the SD in the RNFL thickness. The relative SS change is an independent predictor of SD. The overall mean RNFL thickness, RE, AL, MD, PSD, and age did not significantly correlate with the SD of RNFL thickness.
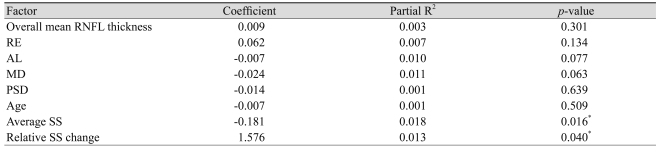
Multivariate regression analyses: associations between various factors and SD in overall mean RNFL thickness
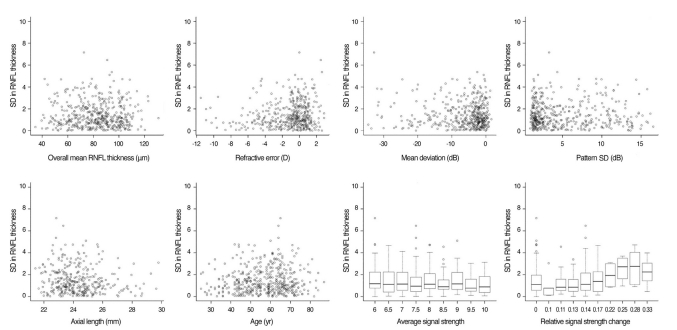
The standard deviation (SD) of 406 overall mean retinal nerve fiber layer (RNFL) thickness measurements plotted against various factors for all subjects.
Discussion
In our participant's demographic (Table 1), the normal group and the glaucoma group had few differences, with the exceptions of visual field index (MD and PSD value), average SS, and AL. Poorer MD and PSD values and lower average SS in the glaucoma group compared to the control group should be expected. The AL was shown to be higher in the glaucoma group. This result is similar to the conclusion that glaucoma frequently develops from myopia [14].
The previously studied reliability of the Stratus OCT showed that the reproducibility of RNFL thickness measurements could be expressed with the coefficient of variation or test-retest variability [9,15]. Since the SD could be calculated from the coefficient of variation and the test-retest variability, the authors used the SD to compare the variability among studies. Budenz et al. [9] reported that the SD for the mean fast RNFL thickness measurement in the normal and glaucomatous eyes was 2.35 and 3.3 µm, respectively. The quadrant SDs ranged between 3.85 and 6.9 µm. In Tzamalis' study [15], the SD for the mean fast RNFL thickness measurements in the normal and glaucomatous eyes was 2.90 and 3.45 µm, respectively. The quadrant SDs ranged between 4.88 and 7.83 µm. We found that the SD values in our study were similar to those in previous studies (Table 3).
The SD depended on the size of the area included in the measurement. The larger was the area sampled, the better was the reproducibility in the current study as well as in previous studies [9,10]. The reproducibility can be increased by increasing the sample density or by increasing the number of A-scans performed for each measurement [16].
Blumenthal et al. [17] reported that glaucomatous eyes showed considerably less reproducibility than normal eyes in RNFL thickness measurements using OCT 2. In Budenz's study using the Stratus OCT, the RNFL thickness measurements in glaucomatous eyes were slightly more variable than those of normal eyes (test-retest variability calculated as two times the SD; normal eyes, 3.5 µm; glaucomatous eyes, 5.2 µm) [9]. In our study, the mean SD of all RNFL thickness measurements except in one sector was larger in the glaucoma group. Although there was no statistically significant difference between the mean SD in the overall mean RNFL thickness measurement, glaucomatous eyes tended to be more variable than normal eyes in RNFL thickness using the Stratus OCT. Therefore, clinicians should be careful in interpreting RNFL thickness using OCT with glaucomatous patients.
Our results showed statistically significant values in the multivariate regression analysis, but the explained variance (R-square) was low. This finding means that a variety of factors in addition to those evaluated may affect the reproducibility of the RNFL thickness measurements using the Stratus OCT. According to previous studies, media opacity [18,19], sampling density [16], type of scan [9,11], quadrant measured [9], undilated pupil [11,19], corneal drying [20], and soft contact lens use [21] may affect the overall scan quality and the calculated RNFL thickness. There are many potential explanations for the variability in the RNFL measurements. Most of these variables may be controlled for good reproducibility in the RNFL thickness measurements during OCT scanning. For example, technicians may perform OCT scanning with pupils dilated, artificial tears applied, and soft contact lenses removed. However, there are some factors that cannot be controlled in the OCT scanning. Technicians cannot control the patient's diagnosis, the RNFL thickness measurement, the RE, the AL, the severity of glaucoma (i.e., MD and PSD), or the age of the patient. Although technicians might strive to produce higher SS, this situation is not always possible for many patients in clinical practice. These variable factors may affect not only the variability in the RNFL thickness measurements, but also may present a challenge when using OCT RNFL measurements for longitudinal interpretation of glaucoma progression.
In previous versions of the OCT software, the signal to noise ratio (SNR) was used to objectively evaluate the quality of acquired images. However, its utility is limited as it only takes into account the single A-scan that demonstrates the strongest signal and does not account for the distribution of this signal strength throughout the scan image. The SS is a new image quality parameter introduced in the most recent version of the Stratus OCT software. The SS is a combination of SNR and outperformed SNR in terms of poor image discrimination [22]. In the present study, the average SS affects the variability in the RNFL thickness measurements obtained by the Stratus OCT after the SS values less than 6 / 10 were excluded. It is important to note that, although the OCT scans performed with SS values greater than 5, which is the minimum value suggested by the OCT manufacturer, the higher was the SS of the OCT scan, and the more precise was the RNFL thickness measurement. Furthermore, the relative SS change affected the variability in the RNFL thickness measurements. Wu et al. [23] reported that the difference in SS between the initial and repeat scans positively correlated with the difference in RNFL thickness measurements. To increase the reliability of RNFL thickness measurements, operators should perform OCT scans with the highest possible SS as well as similar SS consistently. Clinicians should use caution when interpreting the progression of glaucoma with RNFL thickness measurements using the OCT with a lower SS or a fluctuating SS greater than 6 / 10.
This study had a few limitations. All repeated measurements were obtained from one single operator in only one visit, eliminating the possibility of placing the landmark between patients in different positions. Although various RNFL protocols may affect variability in RNFL thickness measurements, only the fast RNFL protocol was used in the current study. Further studies may evaluate factors for variability in RNFL thickness in consecutive visits, between operators, and with the standard RNFL protocol or the repeat protocol. Because we excluded subjects that had poor analysis quality (SS <6 or low analysis confidence) in even a single measurement, a large number of subjects were excluded. This point might have affected the results.
In conclusion, glaucomatous eyes tend to be more variable than normal eyes in RNFL thickness measurements using the Stratus OCT. The average SS and relative SS change appear to correlate with variability in the RNFL thickness measurements using the Stratus OCT. Therefore, the results of RNFL analysis should not be interpreted independently of these factors. When glaucoma patients have a lower SS and more SS change, clinicians should be careful in interpreting the RNFL thickness difference. To improve the reliability of RNFL thickness measurements using the Stratus OCT, technicians should strive to obtain the highest and most consistent SS.
Acknowledgements
This work was supported by the Medical Research Funds from Kangbuk Samsung Hospital.
Notes
No potential conflict of interest relevant to this article was reported.