Amplitude of Accommodation among Students of a Malaysian Private University as Assessed Using Subjective and Objective Techniques
Article information
Abstract
Purpose
The purpose of the study was to establish baseline data for amplitude of accommodation (AA) measured using both subjective and objective techniques in students at a private Malaysian university.
Methods
This cross-sectional study was conducted including 34 healthy participants with a mean age of 22.26 ± 1.88 years. AA was measured using dynamic retinoscopy and the push-up, pull-away, modified push-up, and minus-lens techniques.
Results
The mean AA scores for the push-up, pull-away, minus-lens, and modified push-up techniques and dynamic retinoscopy were 11.38 ± 2.03, 10.35 ± 1.64, 9.24 ± 1.18, 8.26 ± 1.44, and 7.2 ± 1.0 diopters, respectively. No AA measurements showed significant difference among ethnicities (Chinese, Malay, and Indian). This study suggested that AA obtained using push-up (p = 0.005) and pull-away (p = 0.017) methods and dynamic retinoscopy (p = 0.041) were significantly different according to sex. No significant difference was observed in AA for the minus-lens (p = 0.051) and modified push-up (p = 0.216) techniques by sex. A moderately negative correlation was found between AA and age for the push-up (r = −0.434, p = 0.010), pull-away (r = −0.412, p = 0.016), and minus-lens (r = −0.509, p = 0.002) techniques and dynamic retinoscopy (r = −0.497, p = 0.003). A weak negative correlation was found between age and AA measured using a modified push-up technique (r = −0.393, p = 0.022).
Conclusions
Mean AA was highest for the push-up technique, followed by the pull-away technique, the minus-lens technique, the modified push up technique, and dynamic retinoscopy. The push-up and pull-away methods and dynamic retinoscopy showed a significant difference in measurement of AA between sexes.
Accommodation is the mechanism by which the focus of the eye shifts from an object in the distance to an object that is closer to the eye [1]. It is known as focusing ability, which allows the object to appear and be maintained with clarity over a large range of distances [2]. Amplitude of accommodation (AA) is the amount of change in dioptric power that the eye can achieve to fixate on nearby objects [2].
Clinical evaluation of AA is essential when patients present with symptoms that indicate binocular vision anomalies. In a 1-year clinical trial, Montes-Mico [3] showed symptoms of binocular vision dysfunction in 56.2% of their participants, while 61.4% of them presented with accommodation disorders; accommodation insufficiency (11.4%) was the most prevalent. In another study, Davis et al. [4] reported a prevalence of symptomatic accommodation insufficiency of 18.2% among school-aged children.
Another study by McBrien and Millodot [5] indicated mean AA scores among university students aged from 18 to 22 years of 10.77, 9.87, 9.28, and 8.63 diopters (D) for early-onset myopes, late-onset myopes, emmetropes, and hyperopes, respectively, while using both the push-up and pull-away methods.
The AA is measured clinically using subjective and objective techniques. Subjective methods used to assess AA are push-up, push-down, modified push-up, and minus lens techniques. Objective methods, such as dynamic retinoscopy, depend on the examiner and are preferable in cases where the response from the patient is not reliable [2].
Mathebula et al. [6] showed mean AA values for pushup, pull-away, and minus-lens techniques and modified dynamic retinoscopy of 10.22, 9.08, 8.43, and 6.58 D, respectively, for an age group from 21 to 27 years. However, Koslowe et al. [7] found mean AA scores obtained by pull-away and pushup methods of 8.94 and 13.55 D, respectively, for participants from 7 to 35 years old.
A study conducted in Malaysia by Omar et al. [8] showed the average AA among Malaysian athletes and non-athletes aged from 13 to 16 years using the push-up technique. The average AA results for athletes were right eye, 12.47 ± 1.76 D; left eye, 12.51 ± 1.89 D; and both eyes, 12.49 ± 1.76 D; those for non-athletes were right eye, 11.89 ± 1.9 D; left eye, 12.01 ± 1.81 D; and both eyes, 11.95 ± 1.83 D. Majumder and Ying [9] also showed AA using a minus lens technique of 9.72 ± 1.77 D at primary gaze among Malaysian participants whose ages ranged from 18 to 26 years. To date, no study has investigated AA among university students using both subjective and objective methods. Therefore, this study aimed to create baseline data regarding AA for students at a private Malaysian university.
Materials and Methods
Study design and sampling technique
This cross-sectional study was conducted among students at a private Malaysian university that were primarily of three different ethnicities (Malay, Chinese, and Indian). The duration of the study was 1 year, and data collection was carried out from July 2019 until November 2019. The sample size was calculated using G*Power software ver. 3.1.9.2 (Heinrich-Heine-Universität, Düsseldorf, Germany). The total sample size required for the study was 34; the effect size was d = 0.5, α err prob = 0.05, and power (1-β err prob) = 0.80. A simple random sampling technique was used to recruit participants. A set of 50 random numbers was generated using Research randomizer software. The first 34 participants who fulfilled the inclusion criteria of consent to participate, student ranging from 18 to 30 years of age, Malaysian national, and best-corrected distance of 6 / 6 and near visual acuity of N6 in each eye were recruited as study participants. The exclusion criteria were amblyopia, strabismus, history of ocular trauma, ocular or systemic disorder, a medication that would interfere with accommodation, oculomotor dysfunction, neurological disorders, and any previous ocular surgery. This study was approved by UCSI University ethical committee. The ethical code was IEC-2019-FMHS-025. All participants provided informed consent prior to taking part in the study. All procedures were performed following the Declaration of Helsinki.
Procedure
All participants were given a detailed explanation of the study, including the procedures, and written consent was obtained from each participant. All participants underwent a detailed review of their ocular, medical, and family history followed by preliminary examinations comprised of visual acuity both near and at distance, stereopsis, extraocular muscle motility, cover test, pupillary evaluation, and color vision. Each participant's refraction was confirmed first by performing retinoscopy on each eye and then by performing subjective refraction and binocular balancing to ensure that the accommodative effort exerted by each eye was equally balanced. An anterior segment evaluation of the eye was performed using a slit lamp, and a fundus evaluation was conducted with an ophthalmoscope. After that, the participants were evaluated to determine whether they met the inclusion criteria. The vertex distance was measured using a ruler and was fixed at 12 mm for every participant.
To standardize the tests, all participants followed the same sequence of dynamic retinoscopy, push-up technique, pull-away technique, modified push-up technique, and minus lens technique. A 5-minute break was given after each technique to avoid fatigue, which can affect reading. The tests were administered by a single examiner, and the results were recorded under the supervision of another observer to avoid bias.
The push-up technique was performed using the Royal Air Force (RAF) rule, which states that the speed by which the target is moved will be constant at 5 cm/sec. The test was performed monocularly. The target was held at 40 cm, and the patient was asked to fixate on an N5 target. The target was moved closer to the patient at a constant speed until the patient reported the target to be a blur. In this test, the inverse of distance from the target to the eye is AA. During this procedure, an overhead lamp was placed on top of the target to ensure constant illumination [10]. Three measurements were performed for each eye, and the average of the three scores was calculated. Fixed instructions were given to every participant to avoid errors in communication [11]. The target was held at a 10-degree downgaze angle, and the RAF rule was fixed at the alar crease for all participants.
The pull-away technique was performed in a similar manner to the push-up technique. The RAF rule was used, and the object in this technique was moved from near to distance until the patient reported that the target appeared clear. The test was performed monocularly. The patient was asked to move the N5 target to achieve clarity, and the constant speed at which the target was moved was 5 cm/sec. The inverse of the distance from the target to the eye was AA. During this procedure, an overhead lamp was placed on top of the target to ensure constant illumination [10]. Three measurements were performed for each eye, and the average of these three scores was calculated. Fixed instructions were given to every participant to avoid errors in communication [11]. The target was held at a 10-degree downgaze angle, and the RAF rule was fixed at the alar crease for all participants.
The modified push-up technique was similar to the pushup technique except the target was viewed through a −4.00 D lens. This test was performed monocularly as a −4.00 D lens was added to the distance correction of the participant, and the subject was asked to fixate on an N5 target at 40 cm. The target was moved closer until the patient reported it as a blur. The inverse of the distance from the target to the eye was AA. During this procedure, an overhead lamp was placed on top of the target to ensure constant illumination [12]. Three measurements were performed for each eye, and the average value was calculated. Fixed instructions were given to every participant to avoid errors in communication [11]. The target was held at 10-degree downgaze angle, and the RAF rule was fixed at the alar crease for all participants.
The minus lens technique was performed using the trial frame so that the vertex distance was constant throughout the tests. This test was performed monocularly. The patient was asked to view an N5 target at 33 cm to counteract the effect of minification induced by the minus lens when the target was placed at 40 cm [13]. A-minus spherical lenses were added to the distance correction in 0.25-D steps. Once the patient reported blurring, the number of minus spherical lenses added to the distance refraction was calculated. The AA was the power of the minus lens added to the distance refraction plus 2.5 D to overcome the overestimation that may occur due to proximity of the target [14].
Dynamic retinoscopy was also performed monocularly in a dimly illuminated room using a retinoscope with the participant's distance correction. A target was held at 40 cm, and the participant was asked to read and maintain the letters clear. The examiner was at 40 cm and observed the horizontal movement (with or against movement) of the streak to determine whether to move inwards or outwards, to obtain the neutrality of the reflex. Once neutrality was achieved at the proper distance from the retinoscope, the spectacle plane was measured. The AA was the inverse of the distance in meters [6]. Three measurements were performed, and an average of these measurements was recorded.
Statistical analysis
The data collected were analyzed using the IBM SPSS Statistics ver. 26 (IBM Corp., Armonk, NY, USA). The descriptive statistics were analyzed for AA and presented as mean ± standard deviation (SD). The normality test was conducted using a Shapiro-Wilk test and was based on the results of parametric tests. A t-test was conducted to determine the difference in AA between sexes when using different techniques. One-way analysis of variance was performed to compare AA among races while using both subjective and objective techniques. A p-value <0.05 was considered statistically significant. Pearson's correlation was carried out to determine the correlation between age and AA for each technique.
Results
Socio-demographic background of the population
A total of 34 students from UCSI University, Kuala Lumpur, were tested for this study. Although participant age range was selected from 18 to 30 years, the available age range of the participants was 19 to 26 years, with a mean age of 22.26 ± 1.88 years. This study included 19 female participants (55.9%) and 15 male participants (44.1%) from three different ethnicities. Out of which 12 Chinese (35.2%), 11 Malay (32.4%), and 11 Indian participants (32.4%).
Descriptive statistics of the five techniques of measuring AA
Table 1 shows the descriptive statistics of all the techniques used in this study to measure AA. The mean, SD, and minimum and maximum values obtained using each technique are listed. The mean AA value was 11.38 ± 2.03 D for the push-up technique, 10.35 ± 1.64 D for the pull-away method, 9.24 ± 1.18 D for the pull-away method, 8.26 ± 1.44 D for the modified push-up technique, and 7.2 ± 1.01 D for dynamic retinoscopy. A paired sample t-test was carried out to assess significant difference between the right eye and the left eye for each technique. No such significant difference was found, and the measurements of the right eye were considered for statistical analysis.

Descriptive statistics of all techniques
Ethnicity and AA
Table 2 shows the means and SDs of the AAs measured by each technique for Malay, Chinese, and Indian participants. One-way analysis of variance revealed no statistically significant difference in AA among ethnicities when using the push-up [F(2,31) = 0.630, p = 0.539], pull-away [F(2,31) = 0.595, p = 0.558], minus lens [F(2,31) = 0.482, p = 0.622], and modified push-up techniques [F(2,31) = 0.052, p = 0.950] and dynamic retinoscopy [F(2,31) = 0.579, p = 0.566]. The results are shown in Table 3.
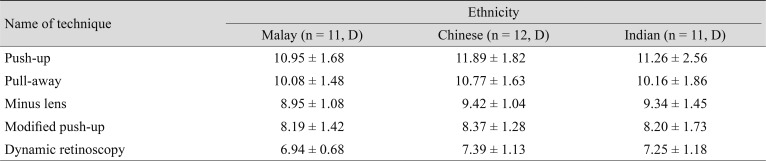
Mean amplitude of accommodation for each ethnicity by technique
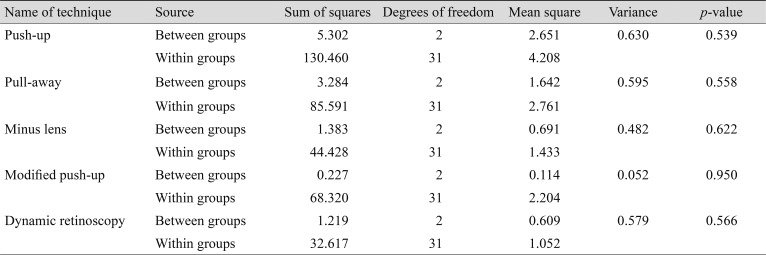
Comparison amplitude of accommodation by ethnicity
Sex and AA
Table 4 shows the mean AA for males and females using each of the techniques. An independent sample t-test showed a statistically significant difference between sexes for the push-up method (M = 12.45, SD = 2.06 for males; M = 10.54, SD = 1.6 for females; t[32] = 3.046, p = 0.005), the pull-away method (M = 11.08, SD = 1.69 for males; M = 9.76, SD = 1.38 for females; t[32] = 2.509, p = 0.017), and dynamic retinoscopy (M = 7.6, SD = 1.03 for males; M = 6.89, SD = 0.91 for females; t[32] = 2.133, p = 0.041), as shown in Table 5. No significant difference was observed between gender with the minus lens (M = 9.68, SD = 1.23 for males; M = 8.89, SD = 1.04 for females; t[32] = 2.027, p = 0.051) or modified push-up technique (M = 8.61, SD = 1.56 for males; M = 7.98, SD = 1.31 for females; t(32) = 1.264, p = 0.216) for measuring AA.
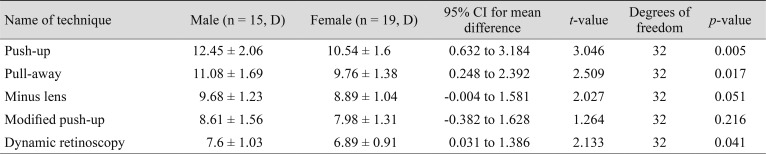
Comparison of amplitude of accommodation between sexes
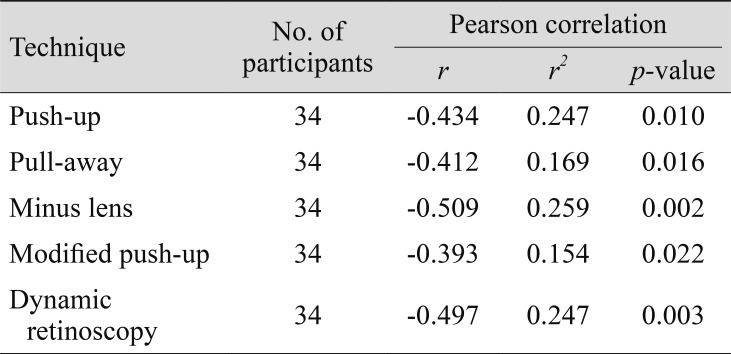
Correlation between age and amplitude of accommodation
Age and AA
Pearson's correlation showed a negative correlation between age and AA for each technique, which suggests that AA decreases with age. The correlation between age and AA for the push-up [r(34) = −0.434, p =0.010], pull-away [r(34) = −0.412, p = 0.016], minus lens [r(34) = −0.509, p = 0.002], and modified push-up techniques [r(34) = −0.393, p = 0.022] and dynamic retinoscopy [r(34) = −0.497, p = 0.003] are shown in Table 5.
Discussion
This study aimed to provide a clinical baseline for AA measured using five techniques (four subjective and one objective technique) in students at a private Malaysian university. This study also aimed to determine the difference in AA by sex and ethnicity as well as the correlation between AA and age.
The current study yielded mean AA for the push-up, pull-away, minus lens, and modified push-up techniques and dynamic retinoscopy of 11.38 ± 2.03, 10.35 ± 1.64, 9.24 ± 1.18, 8.26 ± 1.44, and 7.2 ± 1.0 D, respectively.
The highest value was obtained using the push-up technique followed by the pull-away, minus-lens, and modified push-up methods; dynamic retinoscopy yielded the lowest result. This finding contradicts the results of Momeni-Moghaddam et al. [12], which indicated that the value of the push-up method was highest (11.21 ± 1.85 D), followed by the modified push-up (10.99 ± 1.02 D), pull-away (10.92 ± 1.69 D), and minus lens techniques (9.31 ± 1.61 D). In the present study, the minus lens technique was performed at a distance of 33 cm, and 2.5 D were added to the result to compensate for the working distance [14]. In comparison, Momeni-Moghaddam et al. [12] performed the minus lens technique at 40 cm with addition of the same 2.5 D. In another study, Mathebula et al. [6] found that the mean AA for the push-up method (10.22 ± 1.67 D) was highest, followed by the pull-away (9.08 ± 1.44 D) and minus lens (8.43 ± 1.68 D) techniques and dynamic retinoscopy (6.58 ± 1.34 D), which correlates with the present study, even though their mean AA was lower than that here. Majumder [13] conducted a study in Malaysia and reported AA at different room illuminations for a Malaysian population whose age ranged from 22 to 29 years. The AA was measured using the minus lens technique for highest illumination (23 lux) and was determined to be 9.05 ± 0.58 D. However, the present study was conducted at an illumination of 400 lux, and the AA measured using the minus lens technique was 9.24 ± 1.18 D, which is higher due to the younger age group, testing target, and variation in illumination; a measurement obtained using the minus lens technique at 33 cm and 3 D was added to compensate for the working distance [13]. In another Malaysian-based study, Majumder and Ying [9] found that the AA for an age group ranging from 18 to 26 years was 9.72 ± 1.77 D for primary gaze and 11.26 ± 1.82 D at a 20-degrees downgaze, which was higher than the present study findings (9.24 ± 1.18 D). The difference between the two study findings is due to their viewing angle of the target. In the present study, all measurements were performed at a 10-degree downgaze, whereas Majumder and Ying [9] conducted measurements with a 20-degree downgaze. Moreover, in Majumder and Ying's study [9], the minus lens technique was performed at 33 cm and 3 D was added to the results to compensate for the working distance; the target was N6. Omar et al. [8] measured the AA for athletes and non-athletes from 13 to 16 years of age using the push-up technique (RAF rule). The mean AA scores for the athletes were right eye: 12.47 ± 1.76 D and left eye: 12.51 ± 1.89 D, while non-athletes had scores of right eye: 11.89 ± 1.94 D and left eye: 12.01 ± 1.81 D, which is higher than that found in the current study (11.38 ± 2.03 D). In the present study, the average age was higher than that in Omar et al. [8], which would explain the difference in results. Moreover, in the current study, participants were not separated into athletes and non-athletes [8].
This study showed no significant difference in AA among ethnicities (Chinese, Malay, and Indian) when using the push-up (p = 0.539), pull-away (p = 0.558), minus lens (p = 0.622), and modified push up (p = 0.950) methods and dynamic retinoscopy (p = 0.566). This finding agrees with Majumder [13] that there was no significant difference (p > 0.05) between the AA according to ethnicity in all three-room illuminations of 24, 17, and 4 lux. In another Malaysian-based study, Majumder and Ying [9] showed a significant difference (p < 0.05) between the AA at 20-degree downgaze in Chinese and non-Chinese participants. However, there was no significant difference in AA according to ethnicity at 20 degree upgaze (p = 0.12), primary gaze (p = 0.19), or 40 degree downgaze (p = 0.07). The present study was carried out with the participant in a 10-degree down position, which may have led to the difference from the findings of Majumder and Ying's study [9].
This study showed the AA obtained using the push-up (p = 0.005) and pull-away (p = 0.017) methods and dynamic retinoscopy (p = 0.041) were significantly different between sexes. However, no significant difference was found for the minus lens (p = 0.051) or modified push-up (p = 0.216) technique. Majumder [13] reported no significant difference p > 0.005) in AA according to sex for any of the room illuminations (p = 0.529, p = 0.459, and p = 0.302 for 23, 17, and 4 lux, respectively). In addition, Majumder and Ying [9] showed no significant difference in AA according to sex for all directions of gazes (p = 0.18, p = 0.18, p = 0.68, and p = 0.80) for primary gaze, 20 degrees up gaze, 20 degree downgaze, and 40 degrees downgaze, respectively. Both studies by Majumder and Ying [9] and Majumder [13] supported the present study findings of no significant difference in AA between sexes for the minus lens technique (p = 0.051). The significant differences between sexes for the push-up and pull-away methods and dynamic retinoscopy were likely due to the lower mean age of males (21.67 ± 2.06 years) compared to females (22.74 ± 1.63 years). Additionally, another study by Hashemi et al. [15] showed a significant difference (p < 0.01) in AA between sexes when measured using the push-up technique in an age group from 11 to 17 years. Although the present study's age group is older than that of Hashemi et al. [15], their study supports the present findings. Other studies have offered various results in terms of the relationship between AA and sex; studies with a lower AA in women have been reported to result from hormonal differences from men, especially those after menopause [16171819]. In a study by Ovenseri-Ogbomo et al. [20], AA was higher in boys than in girls, and this difference was attributed to age and the larger sample of boys in younger age groups. Their study findings also support the present outcome.
The correlation between age and AA was computed for each technique. The strength of correlation was analyzed using Evans guidelines classified according to r-value [21]. There was a moderately negative correlation between AA and age for the push-up technique (r = −0.434, p = 0.010), pull-away technique (r = −0.412, p = 0.016), minus lens technique (r = −0.509, p = 0.002), and dynamic retinoscopy (r = −0.497, p = 0.003). A weakly negative correlation was found between age and AA measured using a modified push-up technique (r = −0.393, p = 0.022). This finding was supported by the findings of Atchison et al. [22], who concluded that a significant negative correlation existed between age and AA when measured using the push-up technique. A study by Amiebenomo et al. [23] found a negative correlation between age and AA when measured using the push-up, pull-away, minus lens, and modified push up techniques, which supports the present study's findings. The strength of correlation was not mentioned in their study. Although this study was conducted in accordance with the obtained sample size, further investigations with larger numbers of samples will be required to establish the findings clinically.
The mean AA values for the push-up, pull-away, minus lens, and modified push-up methods and dynamic retinoscopy were 11.38 ± 2.03, 10.35 ± 1.64, 9.24 ± 1.18, 8.26 ± 1.44, and 7.2 ± 1.0 D, respectively. No significant difference was observed in AA among ethnicities. However, a significant difference was noted between sexes for the push-up and pull-away techniques and dynamic retinoscopy. In contrast, a negative correlation was found between age and AA.
Acknowledgements
I would like to show my gratitude to all my fellow colleagues for their valuable suggestions and advice throughout the inquiry. I am thankful to our Department Head, Dean, and Vice-Chancellor of our university for offering me the opportunity to carry out this study. Special thanks are also extended to all the participants who contributed to this research.
Notes
Conflict of Interest: No potential conflict of interest relevant to this article was reported.