Retinal Nerve Fiber Layer Thickness Measurement Comparison Using Spectral Domain and Swept Source Optical Coherence Tomography
Article information
Abstract
Purpose
To investigate the retinal nerve fiber layer (RNFL) thickness concordance when measured by spectral domain (SD) and swept source (SS) optical coherence tomography (OCT), and to compare glaucoma-discriminating capability.
Methods
RNFL thicknesses were measured with the scan circle, centered on the optic nerve head, in 55 healthy, 41 glaucoma suspected, and 87 glaucomatous eyes. The RNFL thickness measured by the SD-OCT (sdRNFL thickness) and SS-OCT (ssRNFL thickness) were compared using the t-test. Bland-Altman analysis was performed to examine their agreement. We compared areas under the receiver operating characteristics curve and examined sdRNFL and ssRNFL thickness for discriminating glaucomatous eyes from healthy eyes, and from glaucoma suspect eyes.
Results
The average ssRNFL thickness was significantly greater than sdRNFL thickness in healthy (110.0 ± 7.9 vs. 100.1 ± 6.8 µm, p < 0.001), glaucoma suspect (96.8 ± 9.3 vs. 89.6 ± 7.9 µm, p < 0.001), and glaucomatous eyes (74.3 ± 14.2 vs. 69.1 ± 12.4 µm, p = 0.011). Bland-Altman analysis showed that there was a tendency for the difference between ssRNFL and sdRNFL to increase in eyes with thicker RNFL. The area under the curves of the average sdRNFL and ssRNFL thickness for discriminating glaucomatous eyes from healthy eyes (0.984 vs. 0.986, p = 0.491) and glaucoma suspect eyes (0.936 vs. 0.918, p = 0.132) were comparable.
Conclusions
There was a tendency for ssRNFL thickness to increase, compared with sdRNFL thickness, in eyes with thicker RNFL. The ssRNFL thickness had comparable diagnostic capability compared with sdRNFL thickness for discriminating glaucomatous eyes from healthy eyes and glaucoma suspect eyes.
Glaucoma is a chronic and progressive disease characterized by the loss of retinal ganglion cells and their axons [12]. Assessment of the retinal nerve fiber layer (RNFL) has been an important target for both glaucoma diagnosis and disease progression monitoring because the RNFL comprises the retinal ganglion cell axons [34].
With recent developments in imaging devices, RNFL thickness can be better evaluated both objectively and quantitatively. Optical coherence tomography (OCT), an imaging device that allows RNFL thickness to be measured, has been increasingly used since it was first introduced [5]. The time domain (TD)-OCT. the earliest type of OCT, has a resolution of 8 to 10 µm and an acquisition speed of 400 A-scans/sec. A more recently introduced spectral domain-OCT (SD-OCT) has much faster scanning speed (24,000 to 55,000 A-scans/sec) with higher axial resolution (3 to 6 µm) than TD-OCT [6]. Recently, swept source (SS)-OCT, has become commercially available, and this OCT uses a longer wave length light. This property could be applied to image the deep tissues such as the choroid or deep optic nerve head. In addition, SS-OCT has faster scanning speed (100,000 to 400,000 A-scan/sec), which reduces the image acquisition time [7].
The purpose of this study was to investigate the concordance between RNFL thicknesses measured by SD- and SS-OCT and to compare their ability to distinguish glaucoma.
Materials and Methods
The participants in this study were subjects from the Lamina Cribrosa Exploration Study and the Investigating Glaucoma Progression Study, which is an ongoing prospective study at the Seoul National University Bundang Hospital Glaucoma Clinic. This study was approved by the Seoul National University Bundang Hospital institutional review board and conformed to the Declaration of Helsinki. Informed consent was obtained from all participants.
Study subjects
All subjects received comprehensive ophthalmic examinations that included visual acuity measurement, Goldmann applanation tonometry, refraction tests, slit-lamp biomicroscopy, gonioscopy, and dilated stereoscopic examination of the optic disc. They also underwent SD-OCT (Spectralis OCT; Heidelberg Engineering, Heidelberg, Germany) and SS-OCT (DRI1 OCT; Topcon, Tokyo, Japan) on the same day by a single well-trained operator. An open angle glaucoma was defined as the presence of glaucomatous optic neuropathy, such as rim thinning, notching and RNFL defect, and associated visual field loss with an open iridocorneal angle. Glaucomatous visual field defect was defined as (1) outside the normal limits on a glaucoma hemifield test, (2) 3 abnormal points, with p-value less than 0.05 of being normal, one with p-value less than 0.01 by pattern deviation, or (3) a pattern standard deviation of less than 5% confirmed on two consecutive reliable tests (fixation loss rate ≤20%, false-positive and false-negative error rates ≤25%).
Glaucoma was suspected if the participant had an optic disk that was suspicious for glaucoma based on stereo photograph review or ocular hypertension (intraocular pressure >21 mmHg) without a history of repeatable glaucomatous visual field damage. A normal subject was determined to have an intraocular pressure less than 21 mmHg, normal-appearing optic nerve head without asymmetry, cupping, hemorrhages or notches; normal RNFL was determined by red-free fundus photo and normal visual field results (i.e., the absence of glaucomatous visual field and neurological defects).
The following were used as exclusion criteria: a best-corrected visual acuity level worse than 20 / 40, spherical equivalent greater than ±6.0 diopters, cylinder correction greater than ±3.0 diopters, history of any ocular surgery except uncomplicated cataract, presence of a disease that could affect the peripapillary area (where OCT measurements were obtained), or presence of any retinal and/or optic nerve disease other than glaucoma.
Optical coherence tomography
The circumpapillary RNFL thickness was measured using SD-OCT (Spectralis) and SS-OCT (DRI1) with a 3.46 mm-diameter scan circle centered on the optic disc. The Spectralis OCT combines confocal laser scanning ophthalmoscopy, which enables real-time 3D tracking of eye movements, with real-time averaging of multiple B-scans (870 nm axial resolution) acquired at an identical location of interest on the retina, in order to reduce speckle noise. Spectralis provides RNFL thickness values for four quadrants, six sectors, and a global average (360 degree measure). The DRI1 OCT uses a light source of a wavelength- sweeping laser centered at 1,050 nm, with a repetition rate of 100,000 Hz (scan circle diameter). DRI1 OCT provides RNFL thickness values for four quadrants, a 12-hour clock, and a global average.
Statistical analysis
For the sample size calculation, the results of a pilot evaluation were used, and the mean difference of the average RNFL thicknesses between the two devices measured to be 10 µm, with an expected standard deviation of 20 µm, were compared. Using a confidence level of 95% and a power of 80%, 128 subjects were estimated to be necessary for sufficient power comparisons in each group. By including 183 patients in each group, with an expected standard deviation of 20 µm, a difference of 4.16 µm could be distinguished. Clinical characteristics of healthy, suspected glaucoma, and glaucoma eyes were compared by an analysis of variance and the Turkey test as a post hoc analysis.
The average and four quadrants of RNFL thickness measured by the SD-OCT (sdRNFL) and RNFL thickness measured by the SS-OCT (ssRNFL) thickness were compared by paired t-tests. The correlations between sdRNFL and ssRNFL measurements were assessed by the Pearson correlation coefficient. A Bland-Altman plot was graphed for the average, and four quadrants were used to assess the agreement between the sdRNFL and ssRNFL measurements. The ability of two OCTs to discriminate glaucomatous eyes from healthy and suspect eyes was determined by the area under the curve (AUC) of the receiver operating characteristics. Statistical analyses were performed using the IBM SPSS ver. 19.0 (IBM Corp., Armonk, NY, USA). Unless otherwise stated, the data are presented as the mean ± standard deviation values, and the cutoff for statistical significance was set at p-value less than 0.05.
Results
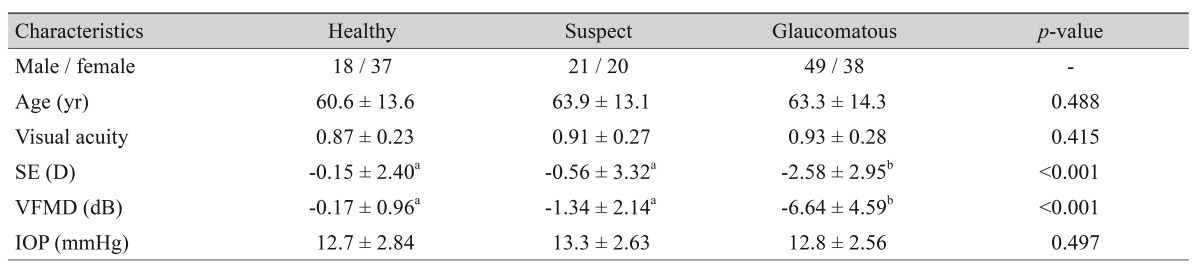
This study included 55 healthy, 41 suspected glaucoma, and 87 glaucomatous eyes. The clinical characteristics of patient participants are shown in Table 1. Eighty-eight were male and 95 were female. The age of healthy, glaucoma suspect and glaucoma participants was 60.6 ± 13.6, 63.9 ± 13.1, and 63.3 ± 14.3 years, respectively. Glaucoma patients had a higher incidence of myopathy than healthy subjects and glaucoma suspects (p < 0.001). The visual field mean deviation was lower in the glaucomatous group than other groups (p < 0.001).
Demographics
Comparison and agreement of retinal nerve fiber layer thickness
The average ssRNFL thickness was significantly greater than the average sdRNFL thickness in all three subject groups (Table 2): healthy (110.0 ± 7.9 vs. 100.1 ± 6.8 µm, p < 0.001), suspected glaucoma (96.8 ± 9.3 vs. 89.6 ± 7.9 µm, p < 0.001), and glaucomatous eyes (74.3 ± 14.2 vs. 69.1 ± 12.4 µm, p < 0.001). The same tendency was found for the quadrant thicknesses, although the tendency did not reach statistical significance in some quadrants (Table 2). The average and quadrant ssRNFL thickness and sdRNFL thickness (average of 183 eyes) were highly correlated (r = 0.97, p < 0.001) (Fig. 1). Significant correlation was also found for all diagnosis groups (Table 3). Among the four quadrants, the highest correlation was found in the inferior sector (r = 0.96, p < 0.001) with the nasal sector as the lowest (r = 0.84, p < 0.001). Fig. 2 demonstrates the Bland-Altman plot for average RNFL measurements of the 183 participants. The ssRNFL minus sdRNFL was positively associated with the ssRNFL and sdRNFL mean (SS - SD = -4.94 + 0.14 × (SS + SD) / 2, p < 0.001), indicating larger discrepancy between the two measurements in eyes with thicker RNFL. A similar tendency was also found for quadrant RNFL thicknesses (Fig. 3A-3D).
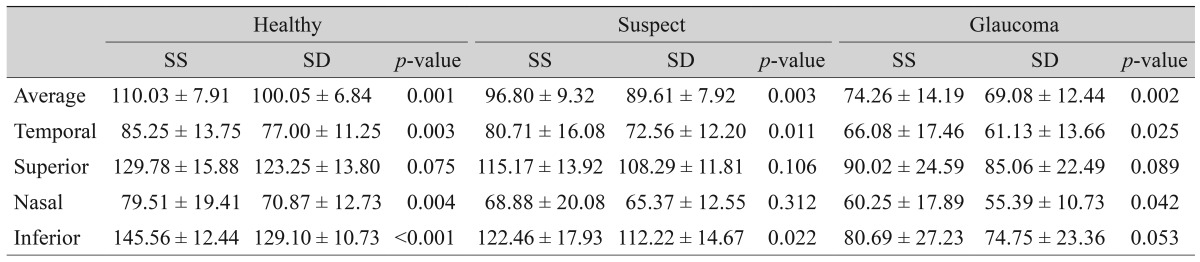
Comparison of retinal nerve fiber laser thickness measured by SD- and SS-optical coherence tomography in different diagnosis groups and quadrants

Scatter plot of the average retinal nerve fiber layer thickness measurements for 183 eyes.
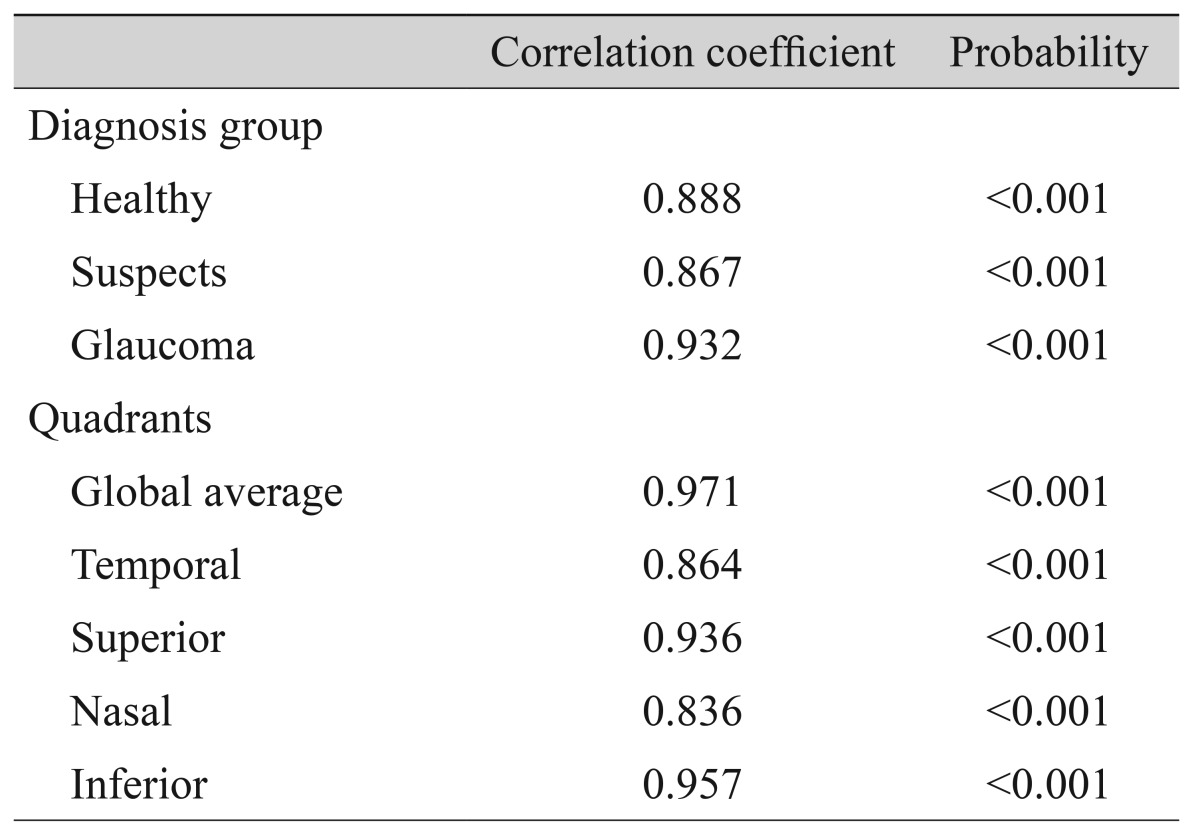
Correlation coefficient between retinal nerve fiber laser thicknesses measured by spectral domain and swept source optical coherence tomography in different diagnosis groups and in different quadrants
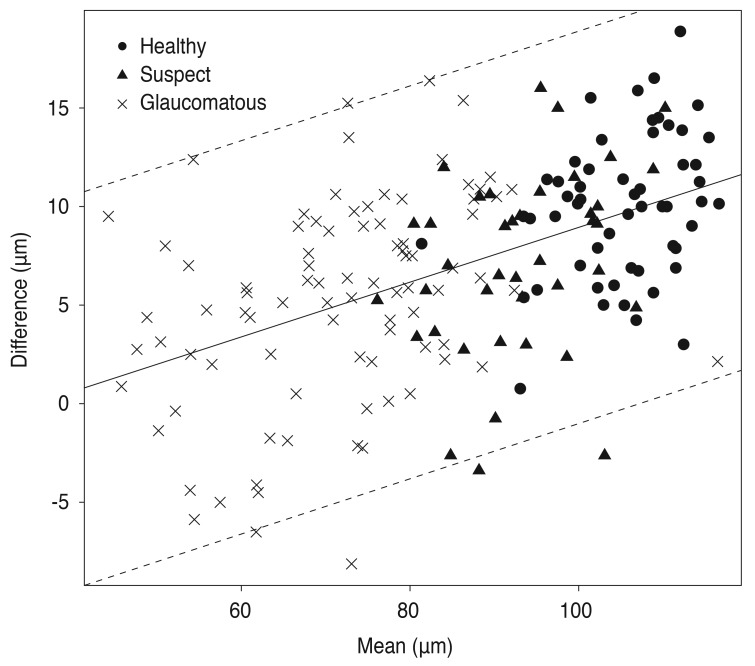
Bland-Altman plot of average retinal nerve fiber layer (RNFL) thickness between swept source and spectral domain optical coherence tomography (OCT). Note that the swept source OCT RNFL thickness was greater than that of spectral domain OCT in eyes with larger RNFL thickness. The solid line indicates the regression line and the dashed lines indicate the 95% limit of agreement.

Bland-Altman plots of agreement of quadrant retinal nerve fiber layer thicknesses between swept source and spectral domain optical coherence tomography at temporal (A), superior (B), nasal (C), and inferior (D) quadrants.
Glaucoma discriminating capability
The AUC of average RNFL thickness revealed that both SS-OCT and SD-OCT performed similarly in discriminating glaucomatous eyes from healthy ones (0.986 vs. 0.984, p = 0.385), and glaucomatous eyes from glaucoma suspect eyes (0.918 vs. 0.936, p = 0.132) (Table 4 and Fig. 4A and 4B). The global average RNFL thickness showed a higher capability for discriminating between diagnosis groups than individual quadrants. The AUC of individual quadrant RNFL thickness was similar between the two OCTs, except for the nasal sector, in which SD-OCT was better than SS-OCT in discriminating glaucomatous eyes from healthy eyes (0.824 vs. 0.768, p < 0.05) and glaucomatous eyes from glaucoma suspect eyes (0.721 vs. 0.618, p < 0.001).
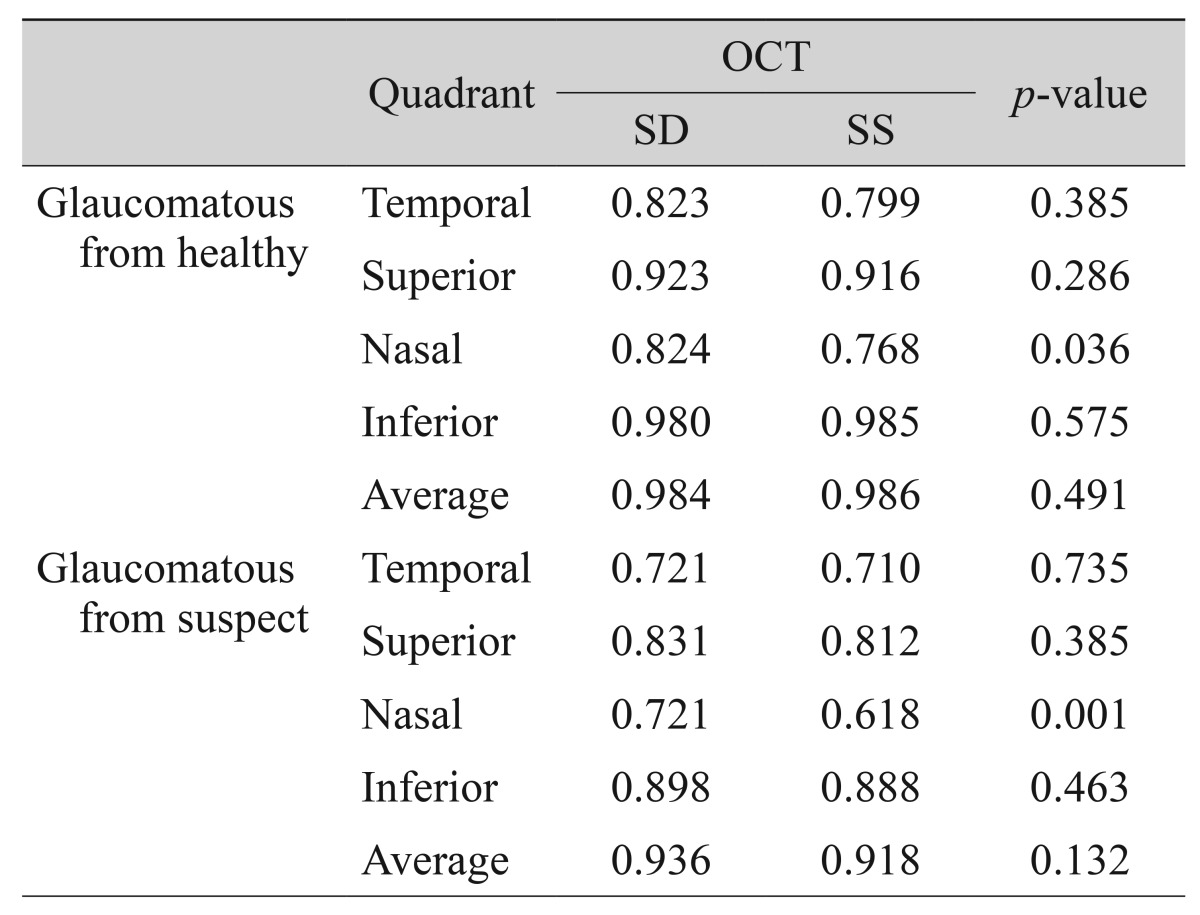
Discriminating ability of SD- and SS-OCT glaucomatous from healthy and from suspect eyes as measured by the area under the curve method

The area under the curve for receiver operating characteristics of retinal nerve fiber layer thickness to discriminate glaucomatous eyes from healthy eyes (A) and suspect eyes (B). SD = spectral domain; SS = swept source.
Discussion
In this study, ssRNFL thickness was greater than that of sdRNFL in all diagnostic groups. There was a tendency for ssRNFL thickness to be increasingly greater than sdRNFL thickness in eyes with thicker RNFL. In comparison, Matsuo et al. [8] observed thicker choroidal thickness with SS-OCT than SD-OCT. The authors assumed that the thicker measurement by SS-OCT may be attributable to a more distinct outer border of the choroid in SS-OCT images, which was most likely because SS-OCT can record choroidal images deeper than the SD-OCT. We did not think that the discrepancy between SD- and SS-OCT in the RNFL thickness was also attributable to this because the RNFL layer was fully visualized using both OCTs. In addition, the increasingly greater difference in eyes with thicker RNFL cannot be explained by the difference in the ability of detecting RNFL borders between the devices.
Although we do not have a clear explanation for the discrepancy between SD- and SS-OCT, there are several possible explanations for this outcome. First, the discrepancy may be attributable to the data processing procedure of the device (e.g., conversion of raw data to RNFL thickness). The increasing discrepancies in eyes with thicker RNFL supports this possibility. However, we do not have detailed information about the software of each device, and thus, could not confirm this possibility. Second, the difference in the diameters of the circle scans of the two devices may contribute to the discrepancy; the Spectralis uses a 3.46 mm scan circle, while the DRI1 uses a 3.40 mm scan circle. The RNFL is thicker near the optic disc and gets thinner towards the periphery [910]. Thus, the RNFL would be thicker when measured with a smaller scan circle (i.e., DRI1). If the thinning of the RNFL from the disc margin to the periphery is stiffer in eyes with thicker RNFL than in eyes with thinner RNFL, the effect of the scan circle difference would be greater in eyes with thicker RNFL. However, it is not currently known whether the RNFL thickness decreases more rapidly as it moves towards the periphery in eyes with thicker RNFL.
Significant positive correlations were observed between ssRNFL and sdRNFL thickness for the global average and individual quadrant RNFL thicknesses. When the quadrant RNFL thicknesses were compared, inferior and superior quadrants had much higher correlation than temporal and nasal quadrants. Similar findings have also been reported between TD- and SD-OCT [1112]. A low degree of correlation in the temporal and nasal quadrants may be explained by less reliable measurements of the RNFL thickness in the temporal and nasal sectors [11].
Similar AUCs between SD- and SS-OCT observed in the current study indicated that both OCTs have comparable diagnostic capability. For both OCTs, the global average RNFL thickness had the highest ability to distinguish between glaucoma and healthy eyes. The inferior quadrant thickness had the highest diagnostic capability, and these findings are in agreement with previous studies. It has been demonstrated that the global average and inferior RNFL thickness were optimal for discriminating healthy eyes from those with glaucoma, using TD-OCT and SD-OCT [1314151617181920]. A high discriminating ability of the inferior and, to a lesser extent, of the superior regions compared to the nasal and temporal regions may be explained by the fact that OCT can more easily detect RNFL changes in the vertical axis because of the thicker RNFL bundles in the vertical sectors [16], which can be substantiated by the fact that glaucomatous changes begin in inferior and superior poles of the optic nerve head [21].
In this study, the global average RNFL thickness had slightly higher AUC than the inferior quadrant thickness. However, there have been conflicting results on this issue. Shin and Cho [18] reported that average RNFL thickness, compared to quadrant values, demonstrated the best diagnostic performance for both TD- and SD-OCT in discriminating between normal and glaucoma patients. Wollstein et al. [22] reported that average and inferior RNFL thickness had the same highest AUC, but average RNFL was more sensitive. In contrast to these results, a better AUC for inferior RNFL than average RNFL has been reported for discriminating glaucoma from glaucoma suspects [1314]. Other studies reported a similar AUC between average and inferior RNFL thickness in discriminating normal and glaucoma suspect eyes [16] and normal and early glaucoma eyes [1720]. Altogether, the ability to distinguish between average and inferior RNFL seems equivocal.
There were some limitations to this study. First, the sample size was relatively small. Thus, further study with a larger sample population may be needed to confirm these findings. Second, the diagnostic performance was not compared, in terms of sensitivity and specificity, for device classification (i.e., less than 1 percentile and less than 5 percentile, etc.) for the measured values. This was because there is currently no normative data for the DRI1. However, when the data becomes available, comparison of the sensitivity at fixed specificity of the classification of the devices would provide additional insight into the diagnostic accuracy of these devices.
In conclusion, although ssRNFL and sdRNFL thicknesses are highly correlated, the thicknesses were significantly different from each other across all diagnostic groups. There was a tendency for SS-OCT to measure a thicker RNFL in eyes and this finding should be considered when a patient undergoes longitudinal follow-up with different OCTs. Both SS-OCT and SD-OCT had high and comparable capabilities for discriminating glaucomatous eyes from suspected glaucoma and healthy eyes.
Acknowledgements
The work was supported by a grant from the Seoul National University Bundang Hospital Research Fund (02-2013-013).
Notes
Part of this work was presented at the Association for Research in Vision and Ophthalmology 2014 Annual Meeting in Orlando, FL, USA on May 4-8, 2014.
Conflict of Interest: No potential conflict of interest relevant to this article was reported.