Evaluation of Hemifield Sector Analysis Protocol in Multifocal Visual Evoked Potential Objective Perimetry for the Diagnosis and Early Detection of Glaucomatous Field Defects
Article information
Abstract
Purpose
Multifocal visual evoked potential (mfVEP) is a newly introduced method used for objective visual field assessment. Several analysis protocols have been tested to identify early visual field losses in glaucoma patients using the mfVEP technique, some were successful in detection of field defects, which were comparable to the standard automated perimetry (SAP) visual field assessment, and others were not very informative and needed more adjustment and research work. In this study we implemented a novel analysis approach and evaluated its validity and whether it could be used effectively for early detection of visual field defects in glaucoma.
Methods
Three groups were tested in this study; normal controls (38 eyes), glaucoma patients (36 eyes) and glaucoma suspect patients (38 eyes). All subjects had a two standard Humphrey field analyzer (HFA) test 24-2 and a single mfVEP test undertaken in one session. Analysis of the mfVEP results was done using the new analysis protocol; the hemifield sector analysis (HSA) protocol. Analysis of the HFA was done using the standard grading system.
Results
Analysis of mfVEP results showed that there was a statistically significant difference between the three groups in the mean signal to noise ratio (ANOVA test, p < 0.001 with a 95% confidence interval). The difference between superior and inferior hemispheres in all subjects were statistically significant in the glaucoma patient group in all 11 sectors (t-test, p < 0.001), partially significant in 5 / 11 (t-test, p < 0.01), and no statistical difference in most sectors of the normal group (1 / 11 sectors was significant, t-test, p < 0.9). Sensitivity and specificity of the HSA protocol in detecting glaucoma was 97% and 86%, respectively, and for glaucoma suspect patients the values were 89% and 79%, respectively.
Conclusions
The new HSA protocol used in the mfVEP testing can be applied to detect glaucomatous visual field defects in both glaucoma and glaucoma suspect patients. Using this protocol can provide information about focal visual field differences across the horizontal midline, which can be utilized to differentiate between glaucoma and normal subjects. Sensitivity and specificity of the mfVEP test showed very promising results and correlated with other anatomical changes in glaucoma field loss.
Early diagnosis and effective monitoring of glaucoma are considered the major concerns and objectives in almost all of the research studies conducted in the field of glaucoma management. Visual field assessment is still the main monitoring tool that reflects progressive glaucomatous functional loss. It has been reported [1,2] that at least 25% to 50% of the retinal ganglion cells must be lost prior to the development of a field abnormality detectable with modern automated visual field testing. The introduction of standard automated perimetry (SAP) has improved accuracy and reduced variability errors compared to earlier kinetic perimeters. However, SAP protocols do not provide a fully accurate visual field assessment profile due to many factors affecting the final results, including and not limited to subjectivity. Almost all perimetry software and testing strategies have attempted to overcome some or all of these problems with various degrees of accuracy and success. Despite its disadvantages, which can be clearly seen with long test duration and variability, the Humphrey field analyzer (HFA) is considered the gold standard method for visual field assessment in clinical practice and glaucoma related clinical trials [1,3]. However, the full-threshold visual field test is currently regarded as a quasi-standard in day-to-day perimetry testing [4]. To more accurately detect glaucomatous visual field defects and their progression, test strategies that provide repeatable threshold estimates in damaged locations are necessary [5]. Multifocal visual evoked potential (mfVEP) is a newly introduced method for objective assessment of visual field impairment. Over the past decades, the method has been used to detect glaucomatous visual field defects with high sensitivity and specificity and to monitor and detect progression of glaucoma through good repeatability figures [6-8]. It was reported [9] that mfVEP can detect damage missed by HFA. Furthermore, abnormal mfVEPs have been reported in patients with normal HFAs.
The ability of the test to provide credible information about the visual field is essentially controlled by its ability to show good repeatability scores. Decisions related to management are mainly dependent on the accurate sensitivity and specificity figures of the test and its ability to show consistent results over time. mfVEP has been shown in many studies to provide a good level of repeatability among normal subjects and glaucoma patients in short and long reassessment intervals [10-15]. For example, Baseler et al. [16] evaluated mfVEP responses in controls and glaucoma patients on two separate occasions and found no significant differences in responses across the field. In two separate studies, Goldberg et al. [17] and Klistorner et al. [18] measured the coefficient of variation between two successive mfVEP tests in two groups and reported a low value (16%) confirming a good level of repeatability of the mfVEP test. Other studies have compared the repeatability of mfVEP tests compared to standard HFA results. For example, Chen et al. [15] reported better repeatability of the mfVEP test, where signal amplitudes were more reliable than SAP thresholds. From previous studies [19,20], it is evident that mfVEP repeatability is at least equal to, or some studies, better than standard SAP results; thus, making the test useful for diagnosis of early-stage glaucoma and as a follow-up tool to monitor progression of the disease.
Materials and Methods
This study was conducted at the ophthalmology outpatient clinic, Hamad Medical Corporation, Doha, Qatar. Study subjects were selected from patients attending the ophthalmology outpatient clinics during the recruitment period, which was between March and June 2012. All study subjects were screened by a full eye examination before enrollment by a glaucoma specialist; including intraocular pressure, Gonioscopy, visual acuity using the Snellen chart, slit lamp assessment of the anterior segment, and retinal examination including the optic nerve head (optic disc). Subjects were categorized into three groups; glaucoma, glaucoma suspect, and normal controls.
Selection criteria for glaucoma and glaucoma suspect patients followed the guidelines of the American Academy of Ophthalmology Preferred Practice Pattern (AAO-PPP) in the precise definition of glaucoma and glaucoma suspect patients [21]. The glaucoma patient group included any patient with previously diagnosed and well-documented features of any type of glaucoma as defined by the AAO-PPP guidelines, including: 1) Patients with evidence of optic nerve damage demonstrated by neuroretinal thinning associated with cupping or other signs of glaucomatous optic disc changes. 2) Reliable and reproducible glaucomatous visual field abnormality consistent with ganglion cell damage, showing a significant difference between the two hemispheres, in the absence of any other causes or explanations. A glaucoma-suspect patient is defined as an individual with clinical findings and/or constellation of risk factors that indicate an increased likelihood of developing glaucoma, including any patient with a well-documented risk factor of glaucoma without any anatomical or functional damage to the optic nerve as defined by the AAO-PPP guidelines. The glaucoma risk factors considered include: 1) Suspicious appearance of the optic disc such as enlarged cup-disc ratio, asymmetric cup-disc ratio, notching or narrowing of the neuroretinal rim, disc hemorrhages, or nerve fiber layer defect. 2) Suspicious visual field for glaucomatous damage in the absence of clinical signs of other optic neuropathy, such as arcuate bundle defect, nasal step, paracentral scotoma, altitudinal defect, or larger mean pattern standard deviation. 3) Consistently elevated intraocular pressure associated with normal appearance of the optic disc and retinal nerve fiber layer and with normal visual field test results. Normal subjects were recruited after excluding any existing ocular pathology. Both genders were equally invited to participate in this study. There was no language restrictions applied when subjects were recruited.
Subjects suffering from visual field defects due to any pathology other than glaucoma, significant retinal disease with or without macular involvement, established neurological deficits affecting the visual cortex or visual pathways, or subjects with amblyopia were excluded from joining this study. Subjects under the age of 16 were not recruited for this study because of the high level of variability and poor reliability of the SAP test for patients under the age of 16 [22-24]. Vulnerable subjects suffering from mental or physical disability, and/or severely debilitated patients needing continuous and special care were excluded from this study.
Multifocal visual evoked potential test
1) Multifocal visual evoked potential test parameters
To measure the amplitude of these responses, the root mean square (RMS) was calculated across the interval from 0 to 500 msec. RMS is commonly used because it requires only the specification of a time interval rather than the identification of a particular aspect of the response waveform. We used a signal window between 0 to 200 msec and a noise window between 300 to 500 msec (Fig. 1). In addition to measuring the RMS of each of the 58 responses for each eye, an signal to noise ratio (SNR) measure was obtained as previously described. In order to obtain the SNR of any segment, a signal window (0 to 200 msec) and a "noise-only" window (300 to 500 msec) are specified. The SNR of a given response is obtained by dividing the RMS of the signal window by the average of the 58 segments × 4 channels = 232 RMS values of the noise-only window.

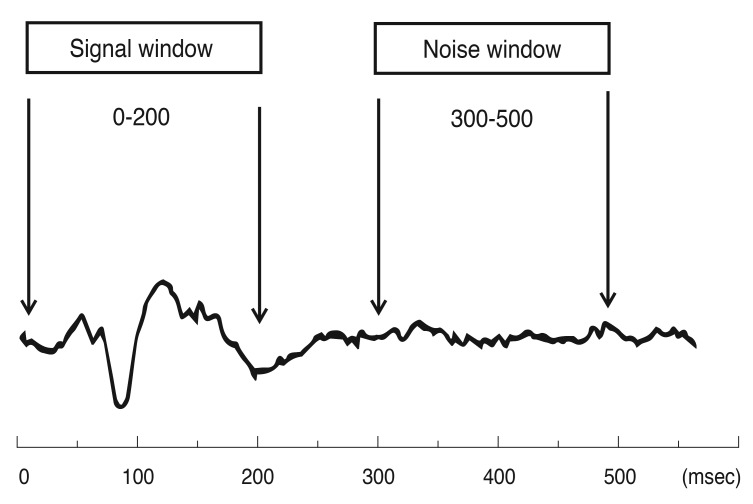
The typical multifocal visual evoked potential signal is divided into two parts (windows) according to implicit time. The signal window between 0 to 200 msec and the noise window between 300 to 500 msec. Signal to noise ratio is calculated based on this division of the waveform.
A response without any signal present would have, on average, an SNR equal to 1.0. The records from the four channels are all oriented in polarity so that if a response was present, it should have a prominent negative component followed by a prominent positive component. There is little or no response present for the record with an SNR around 1.0, and the signal becomes more salient as the SNR increases.
2) Stimulus
According to the guidelines of the International Society of Clinical Electrophysiology of Vision [25] there is a standard requirement for multifocal stimuli. We fulfilled the required standards using a cathode ray tube (CRT) definition frame frequency of 75 Hz, which has been used widely. For CRT displays, the luminance of the stimulus elements in the light state was least 100 cd/m2. The luminance of the display in the dark state was low enough to achieve a contrast (Michelson of ≥90% using an m-sequence) and was used to control the temporal sequence of change between the light and dark stages of each stimulus hexagon. Currently there is no standard display for the mfVEP technique. Recordings have been obtained using the dartboard pattern which is a standard option (Dart Board 58 with Pattern Segments) of the Roland Consult GmbH software, RETIscan (Roland Consult, Brandenburg, Germany). A modified version of this pattern was recently introduced as part of the hemifield sector analysis (HSA) protocol (Fig. 2). The modification is based upon the novel idea of the present study to record the SNR values of each segment (Fig. 3A), then calculating the average of individual sectors that contain a fixed number of segments (Fig. 3B). Each sector SNR value in one hemisphere was compared to its corresponding sector in the other hemisphere to calculate the difference between the two fellow sectors. Similar averaging and calculations were done in a hemi-ring group of segments arranged circumferentially around the central part as shown in Fig. 3C and 3D. SNR values from each two fellow hemi-rings were compared to see if there was any statistical difference between each couple of sectors/hemi-rings in the three subject groups. The dartboard pattern was presented on a monitor viewed at a distance of 30 cm, and the diameter of the display subtended 44.51 cm. There were 58 sectors in this display and each sector contained 16 checks, 8 black and 8 white. The dartboard pattern covered a central 25° on each side of the fixation point with a nasal extension wing up to 42°. The segments and checks were scaled to be approximately equal in effectiveness, according to cortical magnification factors presented by Baseler et al. [16].
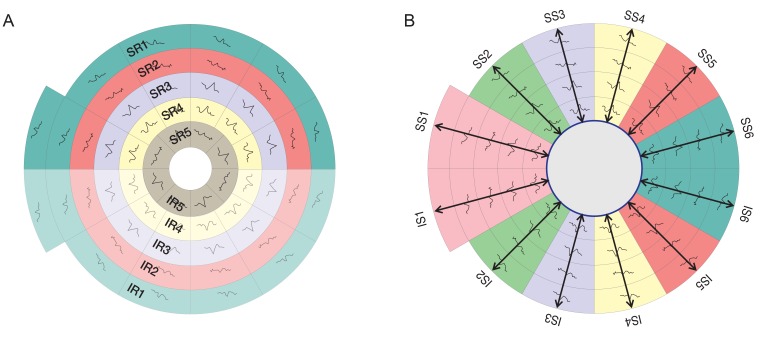
The five allocated hemi-rings and their corresponding fellows in both hemispheres (A). The allocated six sectors and their corresponding fellows in both hemispheres (B). SR = superior hemi-ring; IR = inferior hemi-ring; SS = superior sector; IS = inferior sector.
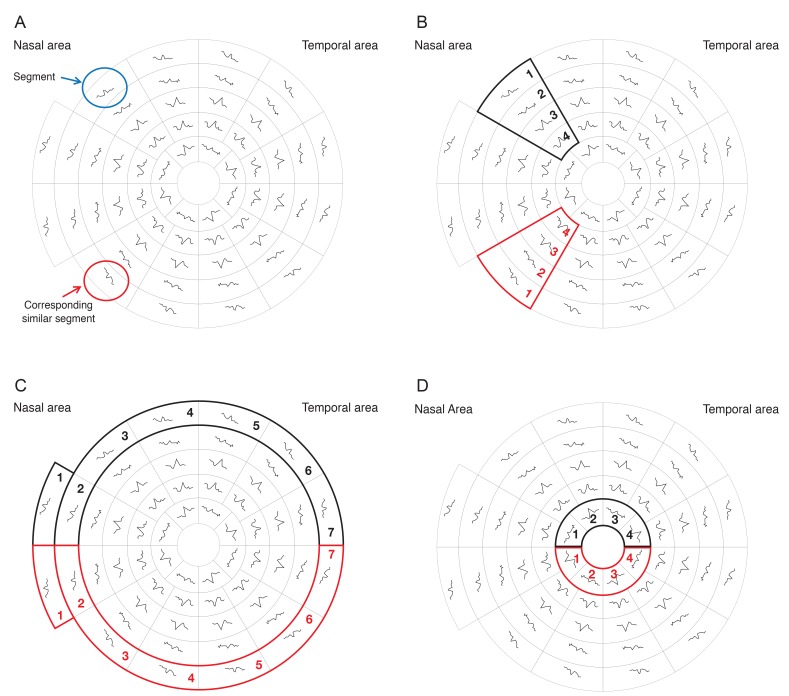
The 58 segments of the right visual field. The field is divided into two identical hemifields across the horizontal meridian; each segment has a similar correspondent in the opposite hemifield. (A) Signal to noise ratio (SNR) value is calculated for each segment. The average SNR of wedge sectors (B) and semicircular sectors; peripheral and central sectors (C,D) are calculated to compare their values to fellow corresponding sectors on the opposite hemifield.
Each participant had undertaken two HFA 24-2 Swedish Interactive Threshold Algorithms (SITA) standard tests with one hour apart during their enrollment period. Patients were instructed in a clear and informative language on how to take the HFA tests effectively without errors. The second HFA test was the study test and all of its data were recorded and analyzed if subjects were within the reliability criteria of 33% false positive and false negative rates and 20% fixation losses. One or both tests could have been repeated on an individual basis if the results were not accurate or if they contained a high level of noise. When finished, each participant got both eyes dilated using a topical mydriatic (dilating drops). When both eyes were fully dilated the patient was prepared and connected to take the second test, which was the mfVEP. During the mfVEP test, the subject was asked to focus on a screen that projected flickering hexagon patterns on the patient's eye. Total time for the 2-run test was 8 to 16 minutes per eye, during which; the examiner was monitoring the patient's eye to observe any unwanted eye movements, which could affect the results. However, those subjects who failed to take any of the tests effectively had to retake them at a later time. A test was counted as "not valid" if it contained too much noise or errors. Total duration of attendance for each subject ranged between 45 to 90 minutes, dependent on individual test-taking variations among the subjects. No follow-up visits were required, and all recordings were taken in a single session.
Recording system
The RETIscan system manufactured by Roland Consult, Germany was the system used for performing all mfVEP tests in this study. All participants were optimally refracted for near vision. An appropriate trial lens was placed in front of the patient's eye during the test for optimal visual acuity in the near distance. Patients were seated 30 cm from the screen and instructed to stay focused on the central target and not to move their eyes during the test.
Hemifield sector/hemi-ring analysis protocol
The concept of the analysis protocol, as described earlier, is to compare and divide the mfVEP field into similar (equal) sectors and hemi-rings across the horizontal meridian, where a sector at the superior hemisphere is compared to its corresponding fellow sector in the inferior hemisphere. The allocated sectors and hemi-rings, shown in Fig. 2, comprise a fixed number of segments. After the SNR value from each segment is recorded, an average is taken from all the segments allocated to any given sector, to give a sector average SNR value. This sector SNR value is the one that will be compared to its corresponding sector across the horizontal meridian and not the individual segments. Certain measurable parameters were recorded and calculated using this HSA protocol in order to compare the three groups. The SNR value in each sector/hemi-ring was compared to its corresponding sector in the opposite hemisphere and the difference was calculated to check for any significant change between corresponding sectors/hemi-rings. The same SNR values and difference between sectors/hemi-rings were also compared to identical ones in the three groups to check for any significant change between groups.
Humphrey field analyzer Swedish Interactive Threshold Algorithms standard 24-2
All study subjects had one or two HFA tests; the first to familiarize the test taker with the test process and to minimize reliability errors. If the subject had already taken the test before and was familiar with the procedure then this first test was waived. The second test was the study test and all of its data were recorded and analyzed. All subjects had the SITA standard 24-2 using HFA automated perimetry as the gold standard visual field test. Measurable parameters recorded in the HFA test included mean deviation (MD), pattern standard deviation (PSD), and glaucoma hemifield test (GHT) grading. Most of these parameters were used in the HFA grading scale of visual field severity.
Statistical analysis
All data obtained from the three study groups were analyzed using the new HSA protocol. mfVEP data from the three study groups were compared to SAP test results to check for significant differences or agreement. The final outcome of comparison and evaluation of the data confirmed or rejected the validity of the new analysis protocol in detecting visual field defects. All SNR values from individual sectors/hemi-rings, in all groups, were tested for normality using the Kolmogorov-Smirnov and shapiro-wilk tests. Each sector SNR value in one hemisphere was compared to its corresponding sector in the other hemisphere to calculate the difference between two corresponding sectors. Similar averaging and calculations were done in the hemi-ring group of segments arranged circumferentially around the central part as shown in Fig. 3C and 3D. SNR values from each of the two corresponding hemi-rings were compared to see if there was any statistical difference between each couple of sectors/hemi-rings in the three subject groups. The paired t-test was performed to check for statistical significance for all sectors and hemi-rings. The one way ANOVA test was performed to check for statistical significance between groups. Agreement between HFA and SNR was perfomed using Kappa statistics. Receiver operating characteristic (ROC) cutoff values for glaucoma and normal groups were used to perform Kappa statistical agreement tests. An SNR value of 1.99 at a sensitivity level of 97% and specificity of 86%, as detected by the ROC curve, was used as a cutoff value; where any response above this value was considered as a normal response. Kappa statistical analysis showed good agreement between HFA and SNR.
Results
A total of 60 subjects (112 eyes) were recruited and enrolled in this study (Table 1). Participants included 20 (38 eyes) normal subjects, 20 (38 eyes) glaucoma suspects, and 20 (36 eyes) glaucoma patients. All subjects had two HFA-SITA standard 24-2 visual tests and a single mfVEP test. All study subjects were able to finish two cycles of the mfVEP test successfully with no significant complaints or side effects. The test duration for the SITA standard HFA test ranged between 4 to 11 minutes per eye, while the duration of a single (two cycles) mfVEP test ranged between 8 to 16 minutes per eye excluding preparation time. The mfVEP preparation time was similar in all subjects and ranged between 13 to 20 minutes per patient. Table 1 shows the age distribution of all subjects in the three study groups. There was no significant difference in age distribution detected among the three study groups (p = 0.673). The mean age for all study subjects was 40.65 years, with no significant preference between genders in any study group. There was no substantial variability in age or gender among the study groups. Subject age ranged between 19 to 72 in all groups, as we tried to cover a wide range of age matched responses in the three groups.
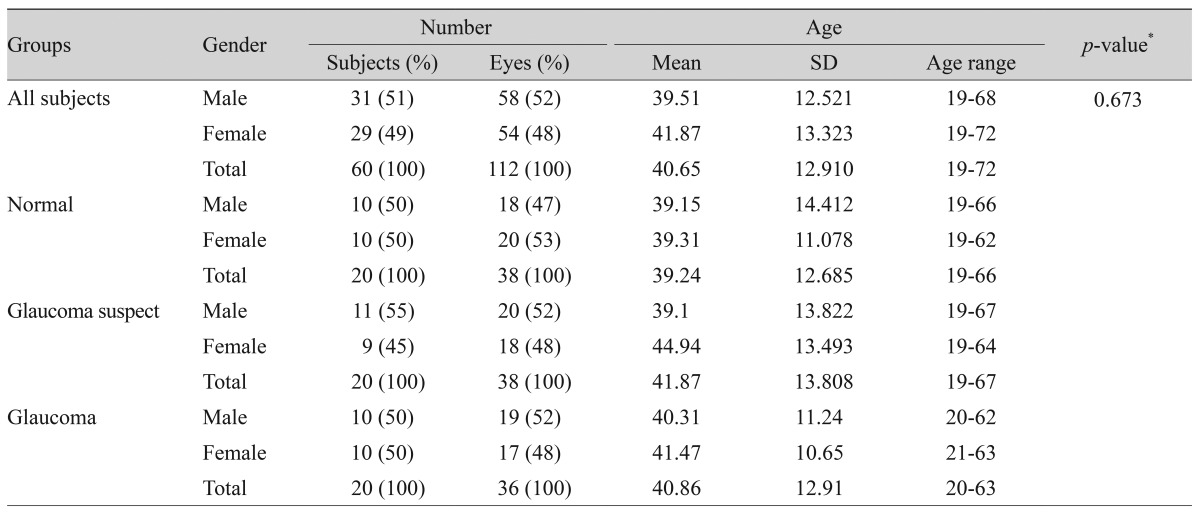
Analysis of age in all study groups
Multifocal visual evoked potential test results
1) Multifocal visual evoked potential sensitivity and specificity figures
Fig. 4 shows the ROC analysis for the glaucoma suspect group. The area under the curve (0.892) displayed high sensitivity and specificity for detection of glaucoma suspect patients (89% and 79%, respectively). We calculated 89% sensitivity using an SNR value of 2.38 as the cut-off for glaucoma suspect patients. Fig. 5 shows the ROC analysis for the glaucoma group. The area under the curve (0.989) displayed high sensitivity and specificity for detection of glaucoma (97% and 86%, respectively). We calculated 97% sensitivity using an SNR value of 1.99 as the cut-off for glaucoma.
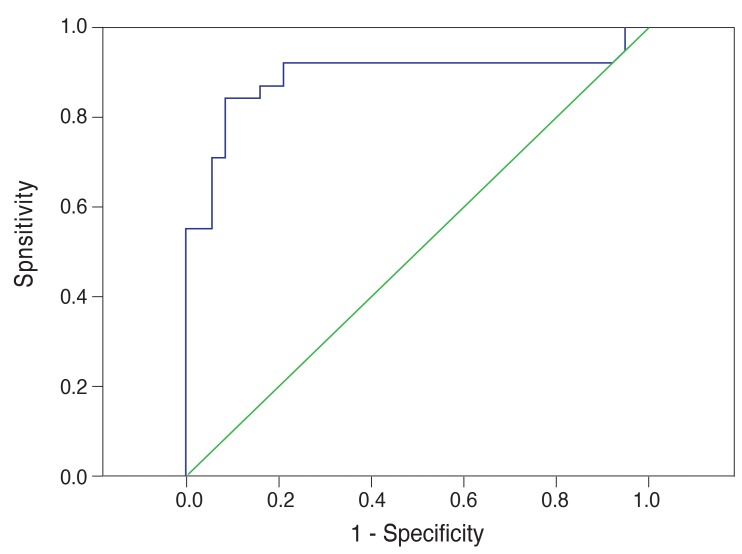
Receiver operating characteristic analysis for the glaucoma suspect group by multifocal visual evoked potential testing in the glaucoma suspect group.
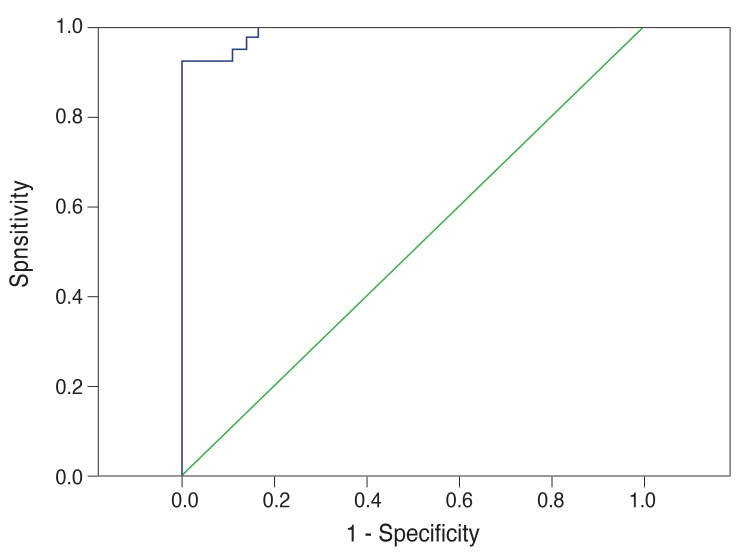
Receiver operating characteristic analysis for the glaucoma group by multifocal visual evoked potential testing in the glaucoma suspect group.
2) Intragroup analysis
Normal group
Twenty normal subjects (38 eyes) were recruited and tested. None of the subjects showed a history or clinical findings of ocular diseases that could interfere with the field of vision as listed in the selection criteria during assessment and examination. Table 2 shows the results in detail; there was only one sector (1 / 6) found significant when compared to its corresponding one on the opposite hemifield, and no hemi-rings (0 / 5) were found to be significant.

Comparison between signal to noise ratio values in superior and inferior hemifield sectors and rings in the normal group
Glaucoma suspect group
Twenty glaucoma suspect patients (38 eyes) were tested. The majority of patients (9 / 20) were diagnosed as glaucoma suspect based on high intraocular pressure recorded on multiple occasions, 5 / 20 had suspicious visual field results, and 3 / 20 had suspicious optic disc appearance without established damage. Six sectors and five hemi-rings on each hemifield were compared to their corresponding fellows on the opposite hemifield. Table 3 shows that 4 / 6 sectors were found to have a statistically significant SNR difference when compared to their corresponding fellows, while 1 / 5 hemi-rings were statistically significant.
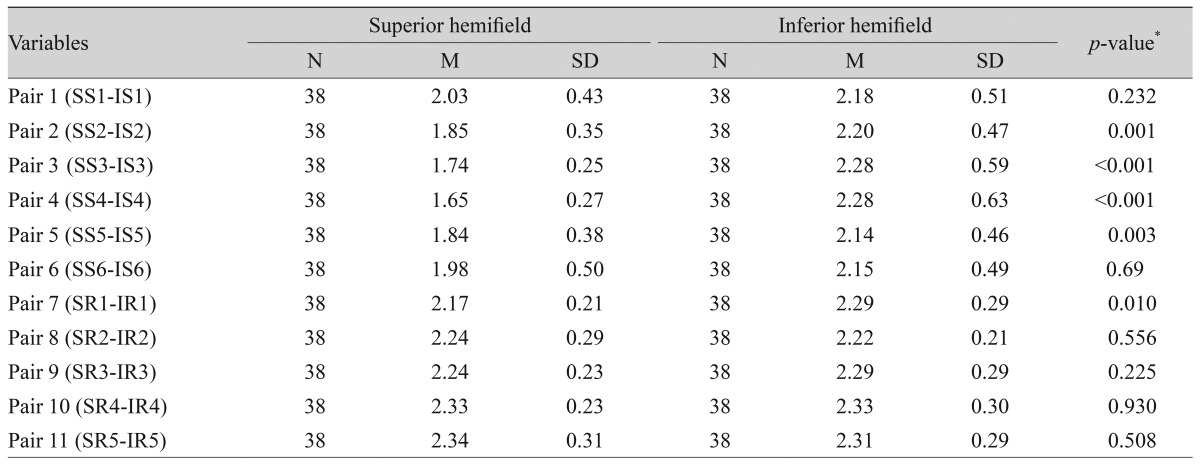
Comparison between signal to noise ratio values in superior and inferior hemifield sectors and rings in the glaucoma suspect group
Glaucoma group
Twenty glaucoma patients (36 eyes) were tested. The majority of patients (14 / 20) had simple open angle glaucoma (OAG), 3 / 20 had narrow angle glaucoma (NAG), and 1 / 20 had pseudoexfoliation glaucoma. There was considerable variation in the severity of glaucomatous field changes among tested patients. Variability ranged between mild to severe glaucomatous field losses using the Hoddap-Anderson criteria described earlier in the methods section. Most of the patients (13 / 20) had asymmetrical glaucomatous field changes between the two eyes, the rest (7 / 20) had symmetrical mild to moderate field changes. The HFA test showed only 3 / 36 eyes with advanced glaucomatous changes with symmetrical severe field loss across the horizontal midline in both hemifields, all the rest (33 / 36) showed clear differences between the two corresponding hemifields. Six sectors and five hemi-rings on each hemifield were compared to their corresponding fellows on the opposite hemifield. Table 4 shows that all sectors and hemi-rings were statistically significant when compared to their corresponding fellows on the opposite hemifield. The results showed that the majority of patients had asymmetrical glaucomatous visual field defects between the two eyes; thus, confirming the importance of the monocular mfVEP test analysis. The mean SNR value for the glaucoma group was 1.70 ± 0.412, which is a low average response close to poor (SNR = 1).
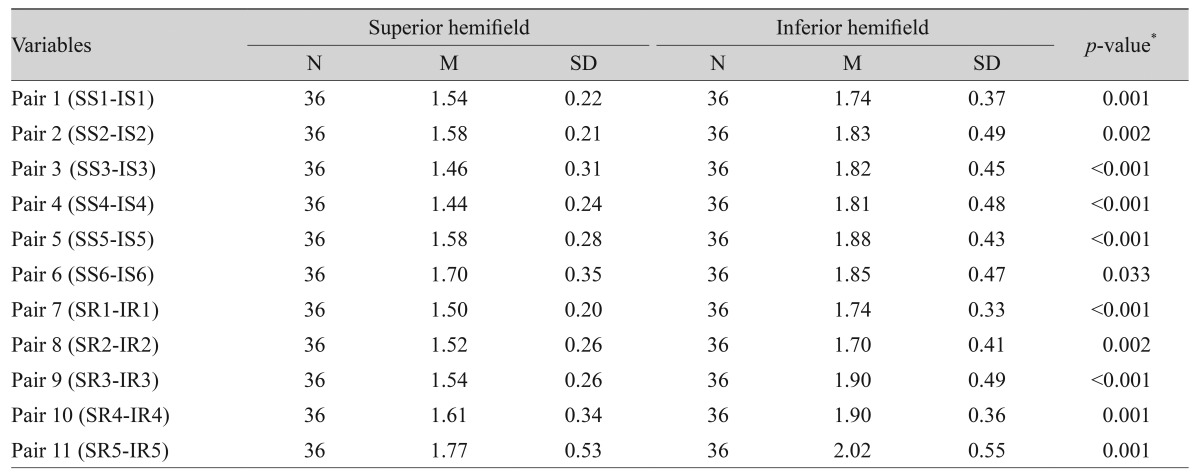
Comparison between signal to noise ratio values in superior and inferior hemifield sectors and rings in the glaucoma group
3) Intergroup analysis
Signal to noise ratio analysis
The SNR values of all sectors and hemi-rings were compared to their corresponding ones in the three study groups and showed statistical significance. Table 5 shows that the normal group represented the highest mean (2.85 ± 0.50) indicating better responses and signal strength, while the glaucoma group showed the lowest mean (1.71 ± 0.41) indicating poor responses and signals. The glaucoma suspect group had a mid-range mean (2.27 ± 0.27) and lower variability. Table 6 shows the SNR values of each individual sector and hemi-ring compared to their corresponding ones in the three groups. The glaucoma suspect sectors and hemi-rings also showed a significant difference when compared to the normal group. Fig. 6 shows the box plot representation of the three groups.

Comparison of total signal to noise ratio values in all sectors between study groups

Comparison between groups of hemifield intersector signal to noise ratio values
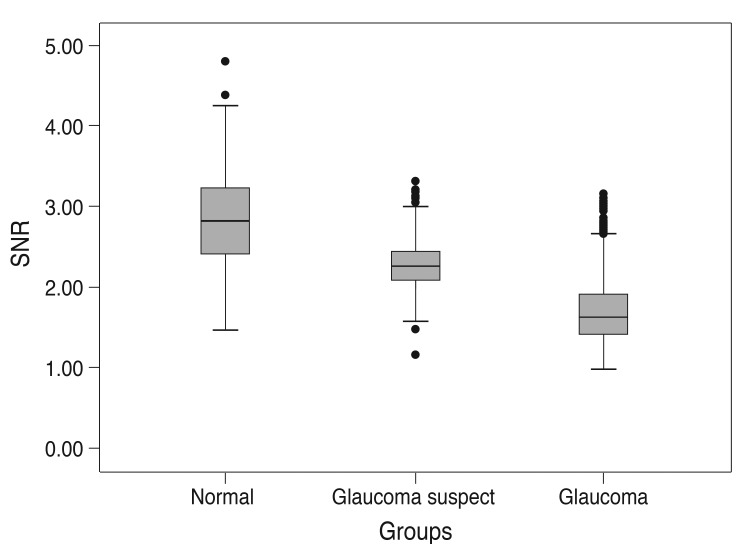
Box plot of signal to noise ratio (SNR) values of multifocal visual evoked potential in normal, glaucoma suspect, and glaucoma groups. There was a significant difference between the mean values among the three study groups.
Analysis of intergroup signal to noise ratio differences
SNR differences between each pair of corresponding sector and hemi-ring in each group were calculated and compared to their corresponding values in the other study groups to identify any statistical significance. Fig. 7 shows a box plot representation of the mean SNR differences in the three groups. The range of SNR differences in the glaucoma group was higher and the mean was significantly higher than the normal group. Table 7 shows that the glaucoma group had the largest SNR difference (mean, 0.36 ± 0.321) compared to the normal group (mean, 0.28 ± 0.22) and glaucoma suspect group (mean, 0.22 ± 0.18). Table 8 shows the SNR differences calculated for each pair of corresponding sector and hemi-ring in each group. SNR differences for 11 pairs of sectors and hemi-rings were compared within the three groups to identify any statistically significant difference among the groups. The SNR difference was statistically significant in four sectors and three hemi-rings. The rest of the tested sectors and hemi-rings were not statistically significant.
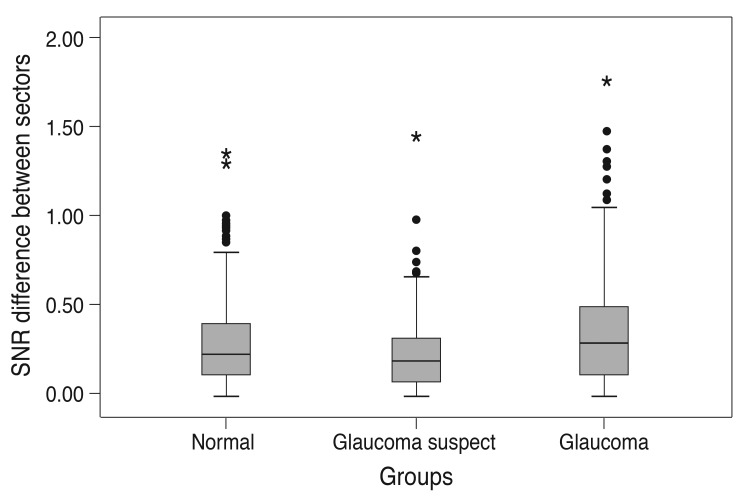
Box plot of the difference in signal to noise ratio (SNR) values of multifocal visual evoked potential in normal, glaucoma suspect, and glaucoma groups. There was a significant difference between the mean values among the three study groups.

Comparison of the total difference in all sectors between study groups

Comparison of hemifield intersector signal to noise ratio differences between groups
Humphrey visual field results
1) Reliability of the tests
Most of the reported tests were counted as reliable (103 / 112) after looking at the reliability index values and the GHT results. The rest of the tested eyes (9 / 112) showed various forms of poor reliability on the two separate tests. Fixation losses were the most common cause of poor reliability (5 / 9) followed by false negatives (3 / 9). False positives were the least common (1 / 9). The majority of normal subjects showed reliable VF tests (36 / 38) followed by glaucoma patients (32 / 36) and glaucoma suspect patients (35 / 38). Among subjects in the unreliable field group, glaucoma patients represented the majority (4 / 9) while normal subjects were the least unreliable among all study groups (2 / 9).
2) Global indices
Two global indices were recorded and utilized in the HFA grading system; PSD and MD. Table 9 shows the distribution of these parameters among all study groups. There were evidently higher values in the glaucoma and glaucoma suspect groups compared to the normal group.
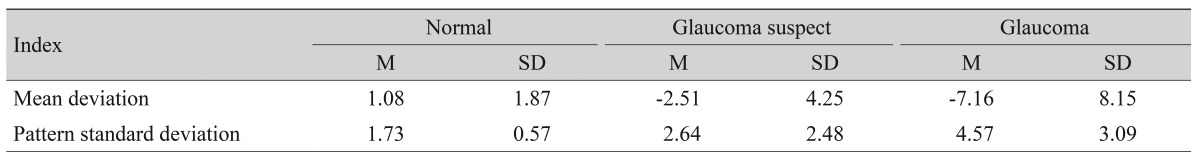
Swedish Interactive Threshold Algorithms standard global indices of the three study groups
3) Agreement between the Humphrey field analyzer and signal to noise ratio results
There was 88.9% agreement between the two tests in identifying normal subjects and 77.8% agreement in identifying glaucoma subjects.
Visual field grading system
1) Humphrey field analyzer grading analysis
Table 10 shows the distribution of visual field test grades in all study groups. The chi-square test was used to identify statistically sign cant differences in the number of tests that were recorded in each grade between groups. We found highly significant variation in the number of tests recorded in each group, indicating good validity of the grading system used. Grade 1 which means a normal visual field test with no abnormalities was recorded for 39 subjects. Among them, 24 were from the normal group, 14 from the glaucoma suspect group, and only one from the glaucoma group. Conversely, grade 5 which indicates severe glaucomatous field loss was not recorded for any of the normal subjects (0 / 16), while the majority were from the glaucoma group (12 / 16) and the rest were from the glaucoma suspect group (4 / 16).

HFA grades among groups
2) Signal to noise ratio grading analysis
Table 11 shows five different ranges of SNR values. Grade 1 stands for a healthy normal response where the signal is ≥3 times the average noise from the entire 58 field segments. Conversely, grade 5 stands for a low SNR value where the signal is almost equal or slightly more than the average noise, which is a value we expect to be found in a damaged sector or focal field defect. All SNR values <1 were considered as pure noise and were not counted in the analysis.

SNR grades among groups
However, on the segment level, there were few <1 recordings mostly in patients with advanced glaucoma. On the sector/hemi-ring level, there was no <1 value calculated because we excluded these values in the average of each sector and hemi-ring. Interestingly, Table 11 shows that grade 1 included 15 eyes; all of them were in the normal group, which gives good credibility to the classification system. Similarly, grade 5, which stands for a poor response, included 7 eyes; all of them were glaucoma patients; thus, further confirming the credibility of this simple classification system. In addition, a highly significant distribution of these grades among the three groups was demonstrated by the chi-square test.
Discussion
We have shown that the Intersector analysis protocol was able to detect visual field defects in both glaucoma and glaucoma suspect groups. In addition, it was able to identify normal subjects as normal responses and accurately differentiated normal responses from glaucomatous visual fields. With such promising results this protocol can be used to monitor glaucomatous changes in subjects with established visual field defects and suspect patients who need close monitoring. Recent evidence suggests that mfVEP can be used to monitor and detect progression of glaucoma through good repeatability figures [6-8]. mfVEP has been used in clinical research on patients with various types of glaucoma to objectively evaluate functional loss in glaucoma. The results confirmed the ability and credibility of the mfVEP test to detect glaucomatous visual field loss. Goldberg et al. [17] used the mfVEP test to detect glaucomatous visual field defects already documented in glaucoma patients. Goldberg et al. found good correlation with HFA field results in glaucoma patients and reported that mfVEP can assess the visual field and identifies glaucomatous visual field defects. In addition, it may have the potential for identifying defects earlier than conventional perimetry.
There are many examples where HFA and mfVEP are not consistent and do not agree in the detection of visual field defects. In this study, the mfVEP analysis protocol detected glaucomatous field defects in both glaucoma and glaucoma suspect patients with a good level of sensitivity and specificity. Sensitivity and specificity of the HSA protocol in detecting glaucoma was 97% and 86%, respectively, and for glaucoma suspect patients the values were 89% and 79%, respectively. These sensitivity values were similar to other research work done on mfVEP perimetry using different analysis protocols. The majority of studies identifying the role of mfVEP in detection of glaucomatous visual field defects confirm its ability to detect already existed damages with high sensitivities ranging between 86% and 97.5%. In addition, mfVEP was shown to identify defects not detected by SAP with lower sensitivities (76% to 92%), which is a very good detection rate compared to SAP results and its limitations in the early stages of glaucoma [7,8]. Graham et al. [6] also reported similar results and showed evidence that mf VEP is an effective method for detecting visual field loss in glaucoma. They suggested that the mfVEP test provides a valuable aid to the clinician in categorizing patients with unreliable, variable, unconfirmed, or excessive subjective field loss.
For decades the HFA offered the gold standard visual field test using the full threshold strategy. Although it showed many shortcomings listed earlier, the HFA remained the best available method for detection and monitoring of glaucomatous visual field losses. The introduction of SITA with its novel method for algorithm calculation rectified some of the problems raised by the lengthy full threshold test and offered a new level of better reliability. After its introduction to the Humphrey analyzer and its integration into the standard software package, SITA became more popular and the majority of clinicians prefer to utilize it in their daily practice. In reality, SITA is not a true full threshold strategy; it is a computer generated program that was developed for the field analyzer II (Humphrey systems) that reduced test-taking time. Through its progress and development, SITA Standard has been shown to reduce test duration by approximately 50% while SITA Fast reduces it by 70% [10]. However, many studies have compared the severity of glaucomatous visual field losses using more than a single test strategy; mainly SITA standard and full threshold algorithms [11,12]. Budenz et al. [13] evaluated visual field defects in patients with glaucoma using SITA standard and full threshold algorithms to determine whether results from these procedures can be compared when monitoring a glaucoma patient. They suggested that care should be taken when using threshold values to compare glaucomatous defects in a patient when converting from full threshold to SITA algorithms. Similar results were also reported [11,12] highlighting the difference in threshold values between the two tests. However, other studies such as Sharma et al. [10] reported no significant difference between the two algorithms in their threshold values.
A new VEP method based upon multifocal technology [14], circumvents the problem. With the mfVEP technique, many (typically 58 to 60) spatially local VEP responses can be recorded simultaneously allowing spatially localized damage to be identified. The limitation of conventional VEP in the assessment of individual locations in the retina raised the idea of using the same principle of objectivity in obtaining information from multiple locations simultaneously rather than summed overall responses. The principle is to stimulate the retina on an isolated rather than cumulative basis, and to process these signals individually in order to draw a map of different retinal sensitivities in various locations. Successful recordings should detect in this case any small scotomas or subtle depressions that reflect early functional loss. mfVEP provides a great extension of this model of multiple simultaneous stimulation of the entire field of vision, presenting its results as a topographic map of the field of vision. mfVEP is a relatively new technique that has yet to find its place as an objective tool accepted in clinical practice. Hood and Greenstein [9] recorded mfVEPs from about 500 patients. Their findings highlight the potential clinical uses of mfVEP as an objective tool in the assessment of glaucomatous visual field defects. These include unreliable HFA tests, questionable or inconsistent HFAs, confirmation of HFA results, and detection of early damage and progression. Recent evidence suggests that mf VEP can be used to monitor and detect progression of glaucoma through good repeatability figures [6-8]. T he important issue of detecting glaucoma at early stages has yet to be thoroughly explored; however, the general answer seems clear. In some patients, mfVEP will surpass HFA in detection of early damage. In other patients, the reverse will be true. There are many examples where HFA and mf VEP are not consistent and do not agree in the detection of visual field defects. Previous studies [9,15] have shown that damage detected by mfVEP is missed by HFA. Furthermore, abnormal mf VEPs have been reported in patients with normal HFAs.
However, the use of latency in mfVEP as a measurable parameter in the diagnosis and monitoring of glaucomatous visual field defects has been a source of controversy among researchers. Some studies, such as Brigell et al. [26], reported almost 100% sensitivity and specificity of mfVEP latency in detecting glaucomatous visual field defects. However, other studies [3,27] reported very small latency differences in fields with glaucomatous defects, indicating that latency is not a useful parameter in mfVEP assessment of the glaucomatous visual field. According to many previous studies, mfVEP signal amplitude shows a significant reduction or loss in glaucomatous visual fields [3,9,14,16]. On the other hand, latency seems to be less sensitive. This could be explained by the mechanism of cell death in glaucoma, where demyelination of the optic nerve is not a feature or expected change in the course of glaucoma. This is in contrast to optic neuritis where marked latency delays are the main pathological change. Klistorner et al. [28] reported similar results and showed evidence that mfVEP can be useful in detecting visual field defects due to central visual pathway lesions. In their study, they performed mfVEP tests on patients with various patterns of visual field loss due to central visual pathway lesions, including patients with known cortical lesions. They reported that mfVEP can detect field loss from cortical lesions but not in some cases of homonymous quadrantanopia, where the lesion may have been in the extra-striate cortex. Another study by Greenstein et al. [29] compared the results of standard HFA perimetry and mfVEP in detecting visual field defects in patients with strabismic amblyopia. They reported that both techniques are able to reveal deficits in visual function across the visual field of patients with strabismic amblyopia. They also found that mfVEP is able to detect field defects in fellow eyes that are not detected by HFA. According to the definition of glaucoma, the disease is characterized by progressive loss of retinal ganglion cells producing very specific and characteristic optic nerve head damage and visual field defects. The shape and morphology of the optic disc is another variable factor that introduces additional difficulty to the initial assessment of glaucoma changes.
Rapid progression in the modification and adjustment of mfVEP testing protocols has led to high expectations, especially with regards to early detection of glaucoma changes, where the role of standard visual field testing procedures is preceded by a significant level of ganglion cell damage. Because of its objectivity and reproducibility, which has been demonstrated in many studies [9,17,26-29], newer research work is aimed at investigating the use of mfVEP testing in early detection of glaucomatous visual field defects. mfVEP has demonstrated variability that arises from anatomical differences in the visual cortex, such as the location of the calcarine cortex V1 in relation to the placement of the external electrodes and differences in the local folding of the cortex within V1 [30]. Newer testing protocols and software have reduced this variability by comparing responses to similar corresponding points; either in the contralateral hemifield or the other eye [30,31]. One of the drawbacks of Interocular comparison (comparing responses in similar locations between the eyes) is the possibility of bilateral glaucomatous damage. Thus, monocular mfVEP testing has been introduced and developed in many studies [9,15,17-19,28-31] resulting in the production of more promising and less variable results, especially in comparison to the use of SNR values. It has been demonstrated that SAP is considered relatively insensitive to early glaucomatous changes, not just due to early anatomical damage of ganglion cells but mainly due to the poor level of reliability [32].
Recent studies suggest that glaucoma suspects, who are at risk for developing significant glaucomatous damage in the future, could benefit from mfVEP studies, where SAP results do not show any significant pathological changes. Thienprasiddhi et al. [8] studied mfVEP responses from the eyes of patients with glaucoma suspect and those with ocular hypertension (OHT) to evaluate whether the technique could detect visual field defects in eyes with normal SAP results. They performed the mfVEP test on three groups; normal controls, glaucoma suspects, and ocular hypertensive patients. They found that mfVEP results were abnormal in 4% of the eyes from the normal control group, while abnormal mfVEP results were detected in almost 20% of the glaucoma suspect eyes and 16% of OHT eyes. They concluded that the new mfVEP technique using the monocular strategy with SNR comparison can detect visual field defects in a minority of eyes with glaucomatous optic discs and normal SAP results. Graham et al. [6] also evaluated the role of mfVEP in glaucoma practice. They reported that 92.2% of low risk suspects had normal mfVEP. They concluded that mfVEP is an effective method for detecting glaucomatous visual field defects.
Our protocol is different in that it overcomes the poor detection problems of binocular analysis and makes the standard reference sectors coming from within the same eye, which should offer more precession and accuracy. According to the pathophysiology of glaucoma, early defects usually start as localized isolated islands in one sector in one hemifield, then they gradually progress over time to form larger defects in one hemifield with similar early changes in the opposite hemifield. However, when the glaucomatous visual field is advanced and both hemifields are equally damaged this analysis protocol will face the same problems and therefore will not be good in detecting significant differences between the two hemifields. Interestingly, even in patients with advanced glaucomatous defects, where both hemifields are damaged, the hemifield analysis protocol probably equally confirmed the defect indirectly by generalized low SNR values for both hemifields. The advantage of this protocol is that it can detect a defect if a significant SNR difference between the two hemifields is recorded. In addition, it can prompt the clinician to downplay SNR values if advanced glaucomatous visual field defects are present. For this reason we modified the analysis protocol and added an SNR grading scale for monocular analysis, which be published soon. The ability of HSA to detect early and subtle visual field changes compared to standard SAP testing protocols has shown good agreement with previous studies.
Other studies [7-10] have shown similar results and provided evidence that mfVEP can detect early glaucomatous visual field defects in glaucoma and glaucoma suspect patients. These results are in agreement with recent studies. As a theoretical framework for judging whether SAP or mfVEP can be more beneficial, Hood and Greenstein [9] provide a better understanding of the two tests based on comparison of matched probability plots between the two tests. They concluded that most of the time mfVEP can detect glaucomatous visual field defects earlier than SAP. However, the reverse can occur as well, assuming that SAP results are reliable. Their analysis suggested that the two tests will often agree. There are significant reasons which made the use of mfVEP as a primary tool for objective visual field testing limited. The test is lengthy, specifically in the two runs mode which is the one used for diagnosis and monitoring, the equipment is expensive compared to conventional HFA and other machines, performing the test needs qualified and well-trained technical staff that can connect the electrodes accurately and monitor for any intra-test errors. Despite this, many patients prefer the mfVEP test over standard HFA testing protocols because it is less dependent on patients' responses. However, for clinicians it cannot be performed on all glaucoma patients in daily practice because of its lengthy testing duration. The interpretation of mfVEP test results is another limiting factor, as it requires the clinician to possess a good knowledge of VEP testing and potential sources of testing error. All these factors have put the mfVEP test behind where it should be as a highly sensitive and repeatable objective perimetry testing tool.
Notes
No potential conflict of interest relevant to this article was reported.