The Effect of Pattern Scan Laser Photocoagulation on Peripapillary Retinal Nerve Fiber Layer Thickness and Optic Nerve Morphology in Diabetic Retinopathy
Article information
Abstract
Purpose
To evaluate the effect of pattern scan laser (PASCAL) photocoagulation on peripapillary retinal nerve fiber layer (RNFL) thickness, central macular thickness (CMT), and optic nerve morphology in patients with diabetic retinopathy.
Methods
Subjects included 35 eyes for the PASCAL group and 49 eyes for a control group. Peripapillary RNFL thickness, cup-disc area ratio and CMT were measured before PASCAL photocoagulation and at 2 and 6 months after PASCAL photocoagulation in the PASCAL or control groups.
Results
The average RNFL thickness had increased by 0.84 µm two months after and decreased by 0.4 µm six months after PASCAL photocoagulation compared to baseline, but these changes were not significant (p = 0.83, 0.39). The cup-disc area ratio was unchanged after PASCAL photocoagulation. CMT increased by 18.11 µm (p = 0.048) at two months compared to baseline thickness, and partially recovered to 11.82 µm (p = 0.11) at six months in the PASCAL group.
Conclusions
PASCAL photocoagulation may not cause significant change in the peripapillary RNFL thickness, CMT, and optic nerve morphology in patients with diabetic retinopathy.
Pan-retinal photocoagulation (PRP) is necessary to inhibit progression and reduce the risk of severe visual loss in proliferative diabetic retinopathy (PDR) [1]. The thermal effect of the laser coagulates surrounding photoreceptors and retinal pigment epithelium (RPE) cells and immediately creates laser burns via photocoagulation of the outer retinal layer. Photocoagulation may decrease metabolic demand and reduce oxygen consumption by coagulated lesions, which are poorly perfused areas [2,3]. PRP is presumed to result in an improved oxygen supply from the choroid to the retina, and thus remains the gold standard treatment for PDR [4].
Even though the Early Treatment Diabetic Retinopathy Study (ETDRS) recommends conventional PRP to control PDR, it is a destructive treatment with laser scar expansion associated with photoreceptor loss and RPE hypertrophy [5]. Longer pulse durations and greater laser energy have caused collateral damage not only in the outer but also into the inner retina [6,7,8,9]. In addition, there have been reports that over time the glaucomatous optic nerve could change, or retinal nerve fiber layer (RNFL) loss could occur after conventional laser photocoagulation [10].
A novel laser method of pattern scan laser (PASCAL) photocoagulation using a shorter pulse duration was introduced in 2005 to reduce unexpected retinal injuries and to allow easier and less time consuming application of laser spots [6,9,11,12]. PASCAL photocoagulation caused less collateral damage and resulted in similar regression of diabetic retinopathy compared to conventional PRP [6,12,13].
Here we evaluated the effect of a new laser delivery system, PASCAL photocoagulation with short laser duration, on peripapillary RNFL thickness, central macular thickness (CMT), and optic nerve morphology in patients with diabetic retinopathy. To our knowledge, this is the first clinical trial to investigate the effects of the PASCAL photocoagulation on peripapillary RNFL thickness, CMT, and optic nerve morphology in diabetic retinopathy over time.
Materials and Methods
Subjects
A single-center, prospective, non-randomized comparative case series study was conducted after gaining institutional review board approval at the Hanyang University Medical Center (Korea) between September 2009 and December 2010. Ninety-eight eyes of 63 patients were included, but 14 eyes of 10 patients were lost to follow-up, and 84 eyes of 53 patients were ultimately enrolled in this study. Written informed consent was obtained from all patients according to the Declaration of Helsinki.
The inclusion criteria were as follows: patients with diabetes mellitus type 1 or type 2, who were older than 20 years and newly diagnosed with severe non-proliferative diabetic retinopathy (NPDR). The exclusion criteria were as follows: high myopia (<-6 diopters), high astigmatism (>5 diopters), presence of disc neovascularization, a history of glaucoma, presence of macular edema (CMT >300 µm), a history of diabetic macular edema, severe medial opacity such as significant cataract or corneal opacity that obscured the field of observation of the fundus, any prior history of surgical treatment or laser photocoagulation, or a history of any other significant ocular disorder of the optic nerve such as optic neuritis, optic neuropathy, uveitis or retinal degeneration. If vitreous hemorrhage, neovascularization of the disc or any other ocular disorders developed in one eye, the involved site was excluded from our study.
Because it may be controversial to present absolute indications for PRP to treat severe NPDR without macular edema, detailed information about PRP for severe NPDR such as protective effects, complications, rescue photocoagulation for worsening disease, and other factors were provided to patients who were choosing between PRP and careful observation [1]. The PASCAL group was comprised of 35 eyes with newly-diagnosed severe NPDR who agreed to have PRP, and the control group was comprised of 49 eyes with severe NPDR who agreed to be examined.
Procedures
All patients underwent examinations of best-corrected Snellen visual acuity, intraocular pressure (IOP) and slitlamp examination of the anterior and posterior segments using a Volk superfield lens (Volk, Mentor, OH, USA). Peripapillary RNFL thickness, cup-disc area ratio of the optic disc and CMT measurements were repeated before PASCAL photocoagulation (PASCAL group) or at baseline (control groups), and again after two and six months.
Pattern scan laser photocoagulation
PASCAL (Optimedica, Santa Clara, CA, USA) is a frequency-doubled Nd:YAG laser with a wavelength of 532 nm [11]. A total of 2,346.4 ± 946.8 (range, 760 to 4,703) laser spots were applied on the superior or inferior halves of the peripheral retina over the course of two sessions. An interval of one or two weeks was maintained between sessions. A laser spot size of 200 µm and a pulse duration of 30 ms were used in the PASCAL groups. The laser power was increased from 200 mW and adjusted to obtain gray-white burns according to ETDRS guidelines. Sixteen spots in a 4 × 4 square grid pattern were simultaneously applied in a rapid raster sequence with a single foot pedal. PASCAL photocoagulation was performed by only one retinal specialist (HYC).
Peripapillary retinal nerve fiber layer thickness, central macular thickness, and optic disc measurements
The peripapillary RNFL thickness, CMT and cup-disc area ratio of optic discs were obtained using optical coherence tomography (Stratus OCT; Carl Zeiss Meditec, Dublin, CA, USA). The programs for fast RNFL thickness, fast macular thickness and fast optic disc scanning were used. The peripapillary RNFL thickness was measured in each quadrant (temporal, superior, nasal, and inferior). The average RNFL thickness was recorded. The CMT was defined as the average thickness in the central 1,000 µm diameter ring of the ETDRS layout. Signal strength less than 6 was excluded with judgment of low reliability for analysis [14]. These measurements were repeated two and six months after the initial visit for PASCAL photocoagulation, and were compared to baseline and between the PASCAL and control groups. The relationship between changes in RNFL thickness and the number of laser burns or any other factors were analyzed.
Statistical analysis
Snellen visual acuity measurements were converted to a logarithm of the minimum angle of resolution (logMAR) score in order to simplify statistical analysis. PASW ver. 18.0 (SPSS Inc., Chicago, IL, USA) was used to analyze the data. Demographic data or baseline parameters of the PASCAL and control groups were compared by the independent samples t-test and chi-square test. The paired t-test was used to compare differences in peripapillary RNFL thickness, CMT, cup-disc area ratio, and visual acuity before and after PASCAL photocoagulation in the PASCAL group or over time in the control group. Simple correlations between the number of laser burns and changes in best-corrected visual acuity (BCVA), average RNFL thickness, or CMT were assessed by Pearson's correlation coefficients. Repeated-measure ANOVA was used to compare the difference in interval changes of measurements between the PASCAL and control groups at the two- and six-month time points, respectively. The statistical significance level was set at p = 0.05 and 95% confidence intervals were determined.
Results
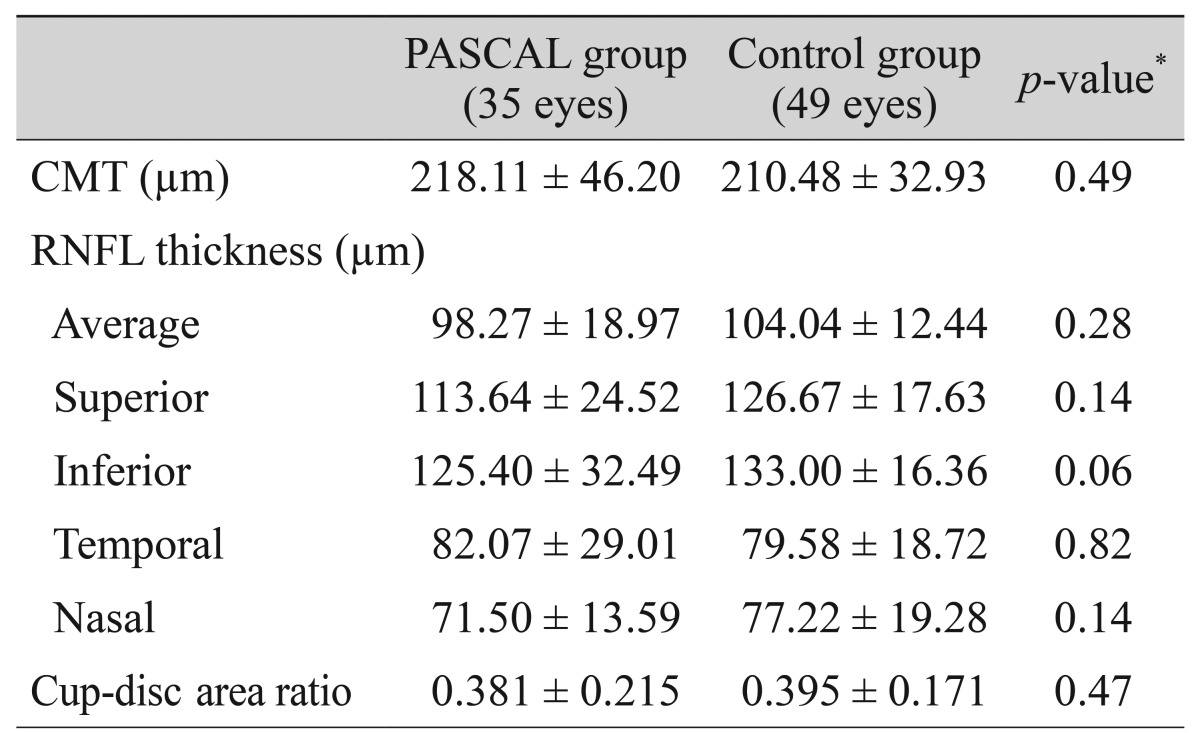
The study included a total of 84 eyes of 53 individuals with a mean age of 57 ± 4.5 years (range, 34 to 80 years). There were 29 males (55%) and 24 females (45%). Patient demographic and clinical data including age, sex, glycosylated hemoglobin level, BCVA, IOP and spherical equivalent did not differ significantly between groups (Table 1). At initial workup, no statistically significant difference in peripapillary RNFL thickness was detected in any quadrant or in the average between the PASCAL and control groups. The cup to disc area ratio and CMT were also not significantly different between the groups (Table 2). No rescue photocoagulation for worsening diabetic retinopathy was needed.
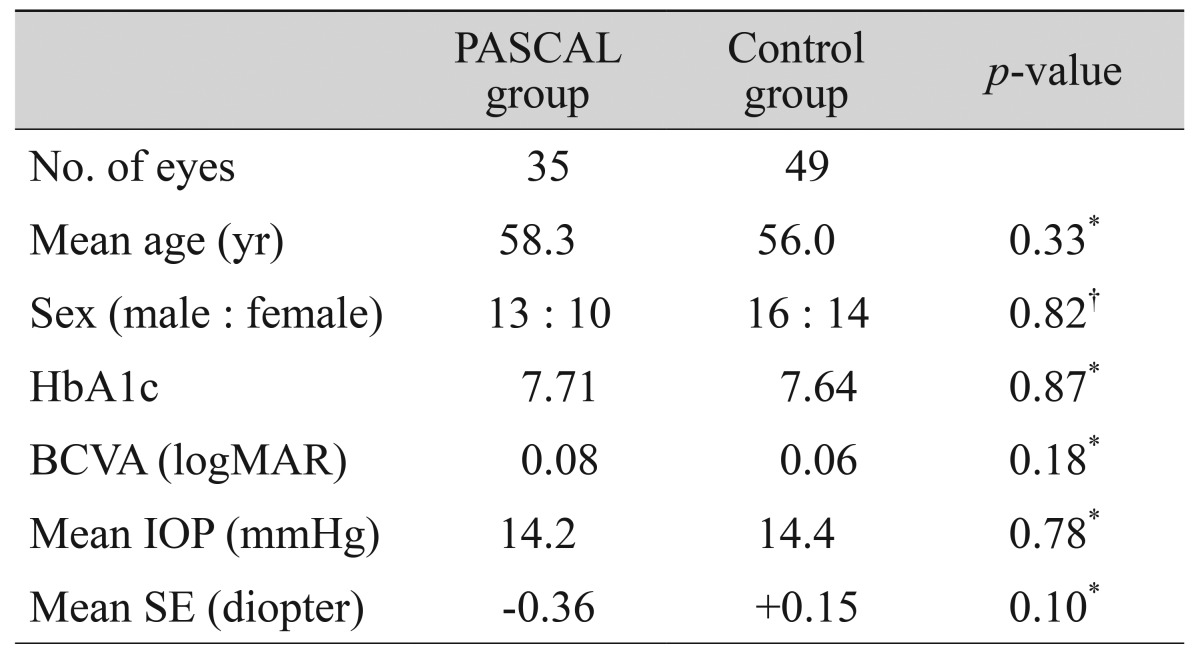
Demographic data of patients
Baseline characteristics
After PASCAL photocoagulation, the inferior RNFL thickness had increased by 7.88 µm (133.28 ± 28.81 µm) at two months compared to baseline (125.40 ± 32.4 µm) and partially recovered to 3.84 µm (129.44 ± 31.62 µm) at six months. On the other hand, superior, temporal, and nasal RNFL area showed a consecutive decrease in thickness at 2 and 6 months after treatment. The average RNFL thickness had increased by 0.84 µm (99.11 ± 18.91 µm) two months after and decreased by 0.4 µm (97.87 ± 18.79 µm) six months after PASCAL compared to baseline (98.27 ± 18.97 µm). However, none of these changes were statistically significant. Also, the control group showed no significant change in RNFL thickness (Fig. 1).

Interval changes in (A) superior retinal nerve fiber layer (RNFL) thickness, (B) inferior RNFL thickness, (C) temporal RNFL thickness, (D) nasal RNFL thickness, and (E) average RNFL thickness at baseline, two and six months later in the pattern scan laser (PASCAL) and control groups. In both groups, all quadrants and average RNFL thickness did not show any significant changes until six months after measurements of baseline and PASCAL (paired t-test, P > 0.05 and p' > 0.05), and there was no significant difference in interval changes of RNFL thickness between the two groups at any follow up interval (p'' > 0.05). p-value: difference between measurements of baseline and after follow up in control group, paired t-test. p'-value: difference between measurements of baseline and after PASCAL, paired t-test. p''-value: difference of interval changes of measurements between PASCAL group and control group at 2 months or 6 months after, repeated-measure ANOVA.
After PASCAL, CMT increased significantly by 18.11 µm (236.22 ± 54.89 µm, p = 0.048) at two months compared to baseline thickness (218.11 ± 46.20 µm) and partially recovered to 11.82 µm (224.40 ± 9.40 µm, p = 0.11) at six months, whereas CMT did not change significantly over time in the control group (Fig. 2). No detectable changes in the cup-disc area ratio of the optic disc were observed in either group (Fig. 3).

Interval changes in central macular thickness at baseline, two and six months later in the pattern scan laser (PASCAL) and control groups. p-value: difference between measurements of baseline and after follow up in control group, paired t-test. p'-value: difference between measurements of baseline and after PASCAL, paired t-test. p''-value: difference of interval changes of measurements between PASCAL group and control group at 2 months or 6 months after, repeated-measure ANOVA.
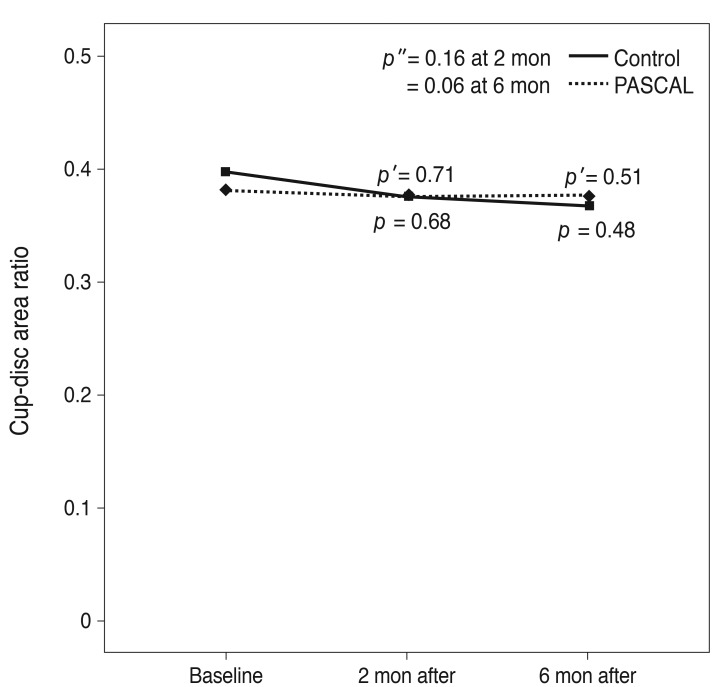
Interval changes in the cup-disc area ratio at baseline, two and six months later in the pattern scan laser (PASCAL) and control groups. p-value: difference between measurements of baseline and after follow up in control group, paired t-test. p'-value: difference between measurements of baseline and after PASCAL, paired t-test. p''-value: difference of interval changes of measurements between PASCAL group and control group at 2 months or 6 months after, repeated-measure ANOVA.
The mean best-corrected visual acuities at baseline were 0.06 logMAR ± 0.025 in the control group and 0.08 logMAR ± 0.036 in the PASCAL group. After PASCAL photocoagulation, visual acuity decreased slightly to 0.11 logMAR ± 0.031 at two months (p = 0.14), and partially recovered to 0.10 logMAR ± 0.031 at six months (p = 0.26). Similarly, visual acuity in the control group decreased slightly to 0.08 logMAR ± 0.014 at the two months (p = 0.24), and remained at 0.08 logMAR ± 0.039 at six months (p = 0.23) in the control group. However, these changes were not statistically significant (Fig. 4).

Interval changes in the visual acuity at baseline, two and six months later in the pattern scan laser (PASCAL) and control groups. logMAR = logarithm of the minimum angle of resolution. p-value: difference between measurements of baseline and after follow up in control group, paired t-test. p'-value: difference between measurements of baseline and after PASCAL, paired t-test. p''-value: difference of interval changes of measurements between PASCAL group and control group at 2 months or 6 months after, repeated-measure ANOVA.
There were no significant correlations between the mean number of laser burns and changes in BCVA (Pearson's correlation coefficient r = 0.004, p = 0.983 after 2 months; r = -0.020, p = 0.911 after 6 months), average RNFL thickness (r = 0.166, p = 0.340 after 2 months; r = -0.002, p = 0.989 after 6 months) or CMT (r = -0.241, p = 0.164 after 2 months; r = -0.102, p = 0.558 after 6 months) after PASCAL (Fig. 5). In addition, the presence of hypertension or diabetic nephropathy was not correlated with changes in average RNFL thickness or CMT over time (Table 3).

Correlations between number of laser burns and changes in best-corrected visual acuity (BCVA) (A,B), average retinal nerve fiber layer (RNFL) thickness (C,D), or central macular thickness (CMT) (E,F) at two months (A,C,E) and six months (B,D,F) after pattern scan laser (PASCAL). There were no significant correlations between the mean number of laser burns and changes in BCVA (A,B), average RNFL thickness (C,D) or CMT (E,F) after PASCAL. Simple correlations were assessed by Pearson's correlation coefficients. The r and p-values for correlations are indicated.

Interval changes in average RNFL thickness or CMT in the PASCAL and control groups according to the presence of HTN or DN
Discussion
There have been several reports of changes in RNFL after conventional PRP in diabetes. Kim and Cho [15] reported a reduction in the nerve fiber layer six months after conventional PRP. In an animal study, the RNFL thickness increased beyond 30 days after treatment of a 100 µm area using an argon laser with 200 mW of power [16]. Muqit et al. [17] described thickening of the RNFL at ten weeks and gradual thinning six months after conventional laser treatment with a multiple-session 100 ms laser using 2,000 burns. They found that thermal diffusion with longer laser pulse duration caused inner retinal axonal damage and then led to a disruption of the mid-flow axonal flow. Such changes may quickly thicken the nerve fiber layer due to axonal edema. In addition, as time passes, axonal edema and direct damage induced by laser treatment may cause axonal cell death and progressive nerve fiber thinning [17].
In PASCAL photocoagulation, a reduced pulse duration should be used to achieve a rapid consecutive raster with a pattern array, so the pulse duration was set to 20 to 30 ms using a semi-automated patterned laser [11,18]. Our study investigates the effects of the PASCAL laser with short pulse durations on peripapillary RNFL, CMT and optic nerve morphology.
Shorter laser exposure was limited to RPE and photoreceptors and thus caused less damage to the nerve fiber layer by decreasing the axial spread of heat toward the inner retinal layer and providing better spatial confinement of the lesion in an animal study [13]. Defect areas after laser photocoagulation were known to be the junction of the inner and outer segments of photoreceptors and apical RPE regardless of pulse duration [12,18]. However, shorter laser duration minimized the amount of burn scars and damage to the nerve fiber layer in an animal study [13].
In our study, there were no significant differences in terms of changes in peripapillary RNFL thickness between the PASCAL and control groups, unlike the changes observed for conventional PRP in previous reports. This may be associated with the shorter laser exposure time of PASCAL photocoagulation. The CMT and average RNFL thickness increased two months after PASCAL photocoagulation and decreased by six months, but these changes were not statistically significant. The early increase in CMT after PASCAL photocoagulation could be explained by cytokine secretion when laser photocoagulation induces the hyperpermeability of retinal capillaries. The slight increase in average RNFL thickness (0.84 µm) two months after PASCAL photocoagulation could also be explained by other factors, such as retinal thickening in the macula [19].
A slight decrease in peripapillary RNFL thickness was observed six months after PASCAL photocoagulation, but it was not statistically significant. The short exposure time of PASCAL photocoagulation does not result in a significant loss of RNFL over the short and long term. No changes in optic disc morphology were noted 6 months after PASCAL.
There was a significant increase in mean CMT two months after PASCAL photocoagulation (18.11 µm increase, p = 0.048). We assumed this increase was due to mild intraretinal inf lammation following the thermal spread of the laser itself, even though it has a shorter pulse duration than conventional laser modalities. At six months, the CMT had recovered (6.29 µm increase compared with baseline, p = 0.11). To summarize, we observed a slight increase in the average RNFL at short term follow-up and recovery at long term follow-up.
We hypothesized that the early decrease in visual acuity was related to the transient initial increase in CMT because of direct injury induced by laser treatment and the hyperpermeability of the retinal vasculature. However, the change in visual acuity was temporary and not statistically significant at two months and was followed by recovery of visual acuity six months after PASCAL. Presence of hypertension or diabetic nephropathy and the total number of laser burns were not correlated with changes in CMT or average RNFL thickness over time.
We note that our study had several limitations. First, the sample size was too small to fully represent a difference in peripapillary RNFL thickness, CMT and optic nerve morphology changes in diabetic retinopathy. Second, our maximum follow-up period was six months. According to previous papers, a significant increase in RNFL at 10 weeks and a reduction in RNFL at 6 months were observed after conventional PRP [16,18]. Therefore, we decided to have 2 months, 6 months, and a year follow-up plans to observe anatomical changes after PASCAL at the beginning of this study, but many patients had already been lost to follow-up after six months. Third, we measured peripapillary RNFL thickness, cup-disc area ratio and CMT with a stratus optical coherence tomography (OCT), which relies on time domain technology. Therefore, it is hard to compare with data from spectral domain OCT, which was recently introduced worldwide with improved data acquisition speed. We believe a larger, multi-center, randomized study with long-term follow-up using spectral domain OCT is warranted.
In conclusion, PASCAL photocoagulation, which is a new laser mode for diabetic retinopathy, did not cause significant change in the peripapillary RNFL thickness, CMT, and optic nerve morphology in our study. As in previous studies about PRP, conventional PRP is considered a destructive treatment due to longer pulse duration, which can cause a change in RNFL thickness and optic nerve morphology [5,6,7,8,9,10]. We suppose that the main difference between PASCAL and conventional PRP is shorter pulse duration in PASCAL. Further study should be performed to compare the changes in RNFL thickness and optic nerve morphology between PASCAL and conventional PRP.
Notes
This article was presented at the spring meeting of the Korean Academy of Ophthalmology on April 2011 in Busan, Korea.
No potential conflict of interest relevant to this article was reported.