Factors Associated with the Signal Strengths Obtained by Spectral Domain Optical Coherence Tomography
Article information
Abstract
Purpose
The aim of this study was to investigate factors associated with the signal strengths (SS, image quality scores) of optic disc and macular images obtained using Cirrus spectral domain optical coherence tomography (OCT).
Methods
Ninety-two glaucomatous eyes were imaged using the Cirrus OCT macular and optic disc cube modes after pupil dilation. The influences of patient age, spherical equivalent, cataract presence, and cataract and glaucoma severity (visual field mean deviation), on the SS of images obtained using the two cube modes were compared between patients whose images showed high SS (SS ≥7) and low SS (SS <7).
Results
The signal strength was significantly higher in images obtained using the macular cube compared to the optic disc cube mode (7.8 ± 1.3 vs. 6.9 ± 1.1, respectively; p = 0.001). Age and visual acuity of patients differed significantly between the high- and low-SS groups when data acquired using the optic disc (p = 0.027 and 0.012, respectively) and macular cube modes (p = 0.046 and 0.014, respectively) were analyzed. When the optic disc cube mode was employed, the extent of cataracts was significantly related to SS, whereas when the macular cube mode was used, none of the factors analyzed was significantly associated with SS.
Conclusions
Age, visual acuity, and the extent of cataracts were significantly associated with images of higher SS when the Cirrus OCT optic disc cube mode was employed.
It is generally accepted that structural change precedes functional loss in glaucoma [1-3]. Therefore, accurate evaluation of structural damage to the optic disc and macula is helpful in early detection of glaucomatous progression.
Non-invasive scanning using optical coherence tomography (OCT) yields valuable quantitative data related to the retinal nerve fiber layer (RNFL) and macular thicknesses. The clinical utility of OCT has been proven in numerous studies. Although good reproducibility of OCT RNFL thickness data has been described [4,5], some studies have indicated that OCT measurements are variable [6]. The data can be significantly affected by OCT image quality. Factors such as the presence of cataracts, the extent of pupillary dilation, and corneal dryness are known to affect image quality and the reproducibility of subsequent measurements [7-9]. Signal strength (SS) is a quality parameter based on signal-to-noise ratios provided by the manufacturer of each OCT instrument and is reported to be associated with RNFL thickness measurements [10-12]. SS ranges from 1 to 10, with higher scores indicating better quality. OCT manufacturers recommend that an acceptable image quality SS score is 5 or higher, and some reports have indicated that an SS score of at least 6 is required to guarantee reliability of test results.
The recently introduced spectral-domain OCT modality offers a higher scan speed and image resolution than afforded by earlier instruments. Cirrus OCT (Carl Zeiss Meditec, Dublin, CA, USA) is a commercially available spectral domain OCT instrument and is reported to offer images of high SS and good quality [13]. However, no report has evaluated factors associated with SS when Cirrus OCT is employed. Thus, we studied factors associated with the SS of macular and optic disc images obtained by Cirrus OCT.
Materials and Methods
All study subjects were recruited in a consecutive manner from our glaucoma clinic; the patients were examined between February and April 2010 at the Asan Medical Center, Seoul, Korea. On initial evaluation, all subjects underwent a complete ophthalmologic examination including the recording of medical, ocular, and family histories; visual acuity (VA) testing; a Humphrey field analyzer (HFA) Swedish Interactive Threshold Algorithm 24-2 full threshold test (Carl Zeiss Meditec); multiple intraocular pressure measurements using Goldmann applanation tonometry; stereoscopic optic nerve photography; and Cirrus OCT. All participants had previously experienced several instances of HFA testing. To minimize any learning effect, only the final HFA test results were used for analysis in the current study. For inclusion, all participants had to meet the following criteria: best-corrected visual acuity (BCVA) of 20 / 30 or better, with a spherical equivalent within ±5 diopters (D) and cylinder correction within +3 D; presence of a normal anterior chamber and open angle on slit-lamp and gonioscopic examination; and reliable HFA test results with a false-positive error <15%, a false-negative error <15%, and a fixation loss <20%. Any patient with any ophthalmic disease that could result in HFA defects or with a history of diabetes mellitus was excluded. One eye was randomly selected if both eyes were found to be eligible. All participants had glaucomatous optic discs, as confirmed and agreed upon by two glaucoma experts (KRS and JHN), and when glaucomatous visual field (VF) defects meeting at least two of the following criteria were present: 1) a cluster of three points with a probability of less than 5% on a pattern deviation map in at least one hemifield, including at least one point with a probability of less than 1%, or a cluster of two points with a probability of less than 1%; 2) glaucoma hemifield test results outside normal limits; and 3) a pattern standard deviation less than 5%.
The severity of cataracts was graded using the Lens Opacities Classification System III criteria [14]. Cataract severity was graded as 0, 1, or 2 according to the extent of nuclear, cortical, and subcapsular opacity. Pseudophakic eyes were excluded. Glaucoma severity was assessed by measurement of VF mean deviation (MD).
All procedures conformed to the Declaration of Helsinki and the study was approved by the institutional review board of the Asan Medical Center at the University of Ulsan, Seoul, Korea.
Optical coherence tomography imaging
Cirrus OCT (software ver. 3.0.0.50) uses spectral-domain technology; an optic disc cube is obtained from a three-dimensional dataset composed of 200 A-scans derived from 200 B-scans that cover a 6 × 6 mm area centered on the optic disc. After creation of an RNFL thickness map from the cube dataset, the software automatically determines the center of the disc and then extracts a circumpapillary circle (1.73 mm in radius) from the dataset to perform RNFL thickness measurements. Maculae were scanned using the macular cube mode; the data were obtained from a three-dimensional dataset composed of 512 A-scans derived from 128 B-scans that cover a 6 × 6 mm area centered on the fovea. We excluded images in which horizontal eye motion was observed within the measurement circle. Pharmacologic dilation was performed on all eyes. All images were acquired by a single well-trained technician.
Analysis
The SS values of macular and optic disc mode images were compared using the paired t-test. The relationship between macular and optic disc mode image SS was assessed by Pearson correlation analysis. Clinical characteristics were compared between high- and low-SS patients imaged in each mode, using the Mann-Whitney U-test. Nominal variables were compared using Fisher's exact test. Logistic regression analysis was performed to identify factors associated with SS. Individual factors were subjected to univariate logistic regression analysis and subsequently were included in the multivariate analysis in a backward stepwise manner if the p-value was less than 0.20. All p-values were two-sided, and p < 0.05 was considered significant. All statistical analyses were performed using SPSS ver. 15.0 (SPSS Inc., Chicago, IL, USA).
Results
Ninety-two eyes of 92 patients (male 32 and female 60) were enrolled. The mean age of the study participants was 54.0 ± 13.8 years and the average MD value yielded by VF testing was -6.7 ± 6.7 dB (Table 1). SS was significantly higher in images obtained by the macular cube mode compared to the optic disc cube mode (7.8 ± 1.3 vs. 6.9 ± 1.1, respectively; p = 0.001). A comparison of the SS values yielded by the two modes showed a statistically significant positive correlation with mode (R = 0.581, p < 0.001) (Fig. 1).

Patient demographics
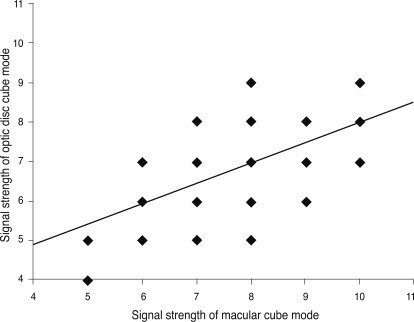
Correlation between the signal strengths of images obtained using the macular cube and the optic disc cube modes of Cirrus optical coherence tomography (correlation coefficient = 0.581, p < 0.001).
Among eyes analyzed by the optic disc cube mode, 31 images were classified as being of low SS (SS <7), whereas 61 were of high SS (SS ≥7). However, when the macular cube mode was employed, 16 and 76 eyes were classified into the low- and high-SS groups, respectively. More patients were classified as high-SS subjects when the macular cube mode was employed compared to those so designated when the optic disc cube mode was used (82.6% vs. 66.3%, respectively; p = 0.002).
Age and VA differed significantly between the high- and low-SS groups when either the optic disc or macular cube mode was employed (optic disc mode: age, p = 0.027, VA, p = 0.012; macular cube mode: age, p = 0.046, VA, p = 0.014). With use of either mode, patients in the high-SS group were younger and had better VA than those in the low-SS group. However, the extent of cataracts and the VF MD did not significantly differ between groups (Tables 2 and 3).
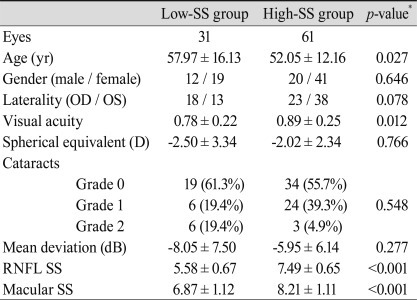
Data on both the low- and high-SS groups obtained using the optic disc cube mode

Data obtained using the macular cube mode from the low-SS compared with the high-SS group
Upon univariate logistic regression analysis, the extent of cataracts was associated with SS when the optic disc cube mode was used. However, no significant factor emerged upon multivariate analysis (Table 4). In the macular cube mode, no analyzed factor was associated with SS upon either univariate or multivariate analysis (Table 5).
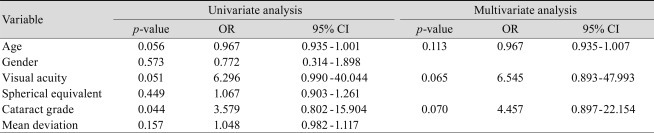
Logistic regression analysis of data obtained using the optic disc cube mode
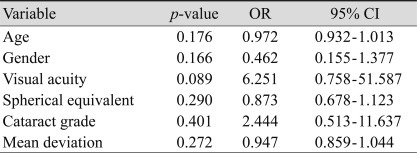
Univariate logistic regression of data obtained using the macular cube mode
Discussion
OCT is now recognized as an important diagnostic tool for providing quantitative data on RNFL and macular thicknesses. An increasing number of clinics employ OCT for structural diagnosis of glaucoma. A critical feature of OCT imaging used in glaucoma diagnosis is the reliability of test results. A high-quality image ensures accurate diagnosis. Cheung et al. emphasized the importance of a high SS when RNFL is measured using OCT [15]. Also, it has been suggested that an SS value of over 7 is essential to guarantee reproducibility of results from the Stratus OCT [11].
In the present study, we investigated factors associated with image SS obtained by Cirrus OCT. Moreno-Montanes et al. reported that Cirrus OCT afforded a higher SS than did Stratus OCT [16]. Although simple SS comparisons between different OCT instruments is not appropriate, because OCT versions might vary in their approaches toward image processing and data analysis, it remains possible that Cirrus OCT may provide higher-quality imaging when image acquisition is performed under the same conditions using different instruments. This is because Cirrus OCT uses a line-scanning ophthalmoscope fitted with a 750-nm superluminescent diode as a light source, which facilitates image alignment [16].
In the present study, images obtained in the optic cube mode were of lower SS compared to those obtained employing the macular cube mode. This can be explained by the reference to fixation. The macula is aligned along the visual axis, whereas the optic disc is located in a position nasal to this axis. Thus, macular images can be obtained by central fixation, whereas optic disc image acquisition requires eccentric fixation. It follows that if the two structures are tested under the same conditions, it would be easier to retain central fixation, rather than defer to eccentric fixation, during image acquisition. Moreover, if the direction of disc attachment with respect to the orbit is unusual, as may be observed with a tilted disc, this can lead to a reduction in SS because reflectance is inconsistent.
Subjects in the high-SS group, evaluated by either OCT mode, were younger and had better VA. This is because young patients cooperate and concentrate more effectively during optical examinations. Also, patients with better VA yield higher-grade fixation data.
Imaging data obtained using the Stratus OCT are known to be influenced by the presence of cataracts [9]. The results of the present work indicate that the extent of cataracts did not differ between the high- and low-SS patient groups. The use of advanced optical features in Cirrus OCT may possibly explain this observation. In addition, the patients of the present study were relatively young, with a mean age of 54 years, and most cataracts (90.2%) were mild, being of grade 0 or 1. All patients were imaged after pupil dilation. These factors may have reduced the effect of cataract presence.
However, logistic regression analysis showed that the extent of cataracts was significantly associated with SS when the optic disc cube mode was employed, and this suggests that scan quality may vary with cataract density when the Cirrus OCT is used, as is the case when the Stratus OCT is employed. Meanwhile no meaningful between-group difference was noted when the macular cube mode was used. Therefore, we suggest that macular image acquisition is more robust. Pupil size can affect both the reproducibility and the quality of images obtained by OCT. To exclude any confounding effects of pupil size, we obtained Cirrus OCT images after pupil dilation in all patients, as mentioned above.
Our relatively small sample size is a limitation of the present study. All images were obtained by a single experienced examiner; this may not reflect the real clinical situation. However, we found that it was more difficult to obtain high-quality images when the optic disc cube mode was employed, compared to the macular cube mode used under similar conditions. Further, we found that age, VA, and extent of cataracts seemed to affect acquisition of high-SS images by the Cirrus OCT. Further work with a larger number of patients is needed to verify the effects of the extent and type of cataracts on image quality, and the impact of SS on glaucoma diagnosis.
Notes
No potential conflict of interest relevant to this article was reported.