The Volume of Tumor Mass and Visual Field Defect in Patients with Pituitary Macroadenoma
Article information
Abstract
Purpose
We used the Swedish interactive threshold algorithms (SITA) standard strategy of Humphrey perimetry, to analyze the pattern of visual field (VF) defects and evaluate the quantitative correlation between the tumor volume and severity of VF defects in patients with pituitary macroadenoma.
Methods
We reviewed 50 patients with pituitary macroadenoma who received VF test and 11 patients were excluded. VF analysis was performed with Humphrey perimeter using the SITA standard strategy. The tumor volume was assessed radiologically via brain magnetic resonance images and was calculated using Cavalieri's principle. We used the mean deviation (MD) and pattern standard deviation (PSD) of the Humphrey parameter to measure VF defect severity, and then analyzed the correlation of tumor volume with VF defects.
Results
Twenty nine patients (74%) showed abnormal VF and bitemporal field changes, which were the most common field defects on presentation. Seven patients (18%) had unilateral VF defects, 22 patients (56%) had bilateral VF defects. The tumor volume of the patients with VF defects was significantly larger than that of patients with normal VF (p = 0.006). The tumor volume exhibited significant negative correlation with MD (r = -0.693; p < 0.001) and significant positive correlation with PSD (r = 0.589; p < 0.001).
Conclusions
In patients with pituitary macroadenoma, there was a variety of VF defects and a high correlation between the tumor volume and the severity of VF defects. SITA standard strategy can be a fast and quantitative method for evaluating central VF defects.
Pituitary adenomas account for approximately 12% of clinically symptomatic intracranial tumors [1]. They are classified into two categories based on their size, microadenoma (less than 1 cm) and macroadenoma (greater than 1 cm) [2]. Pituitary macroadenoma can cause visual field (VF) defects by compressing the optic chiasm or the optic nerve. The prevalence of VF defects in pituitary adenoma varies, ranging from 9% to 32% as reported in the literature [1,3,4]. Because of its anatomical relationship with the optic chiasm, pituitary adenoma typically results in bitemporal hemianopia. However, according to tumor size and optic chiasmal position, a variety of field defects can be produced by pituitary adenoma and the tumor size is a significant factor for the severity of VF defects [5,6].
Goldmann perimetry has been classically considered to be the standard perimetry technique in neuro-ophthalmology. However, several studies reported that most automated perimetry was similar or more sensitive than Goldmann perimetry in detecting and quantifying VF defects in neuro-ophthalmology [7-9]. Recent studies have the Humphrey's full-threshold strategy, however it requires a higher level of understanding and greater concentration by the patient [10,11]. The Swedish interactive threshold algorithms (SITA) family of automated perimetry is the most recently developed and most widely used program resulting in a much shorter VF testing process that is easier for the patient [12].
To the best of our knowledge, there has been no study specifically designed to evaluate the results of SITA strategy in patients with pituitary adenoma. Using the Humphrey's SITA standard strategy, we analyzed the pattern of VF defects and evaluated the correlation between the tumor volume and severity of VF defects quantitatively in patients with pituitary macroadenoma.
Materials and Methods
We retrospectively reviewed the medical records of 50 patients with pituitary macroadenoma who received VF tests in the Department of Ophthalmology and Neurosurgery, Hallym University Sacred Heart Hospital, between August 2000 and June 2008. Eleven patients were excluded because of unreliable VF test results (three patients) or other ophthalmologic disease (eight patients). Our analysis was thus based on the remaining 39 cases. The diagnosis of pituitary macroadenoma was determined by the results of brain magnetic resonance images (MRI).
The patients underwent a complete ophthalmologic examination including best-corrected visual acuity (BCVA), slit lamp biomicrosopy, applanation tonometry, fundus examination and VF test. Patients with ophthalmologic disease or other disease affecting the results of VF test, whose BCVA results were lower than 20/80 in both eyes, and those with recurrence of tumor following previous treatment were excluded.
A VF test was performed before surgery or medication for pituitary macroadenoma with a Humphrey field analyzer 750 (Zeiss-Humphrey, Dublin, CA, USA) using a 4 mm2 Goldmann size III stimulus. The 24-2 SITA standard strategy was used. Each patient underwent VF tests twice on separate days the more reliable result was selected for statistical analysis. The reliability criteria used were fixation losses less than 20%, as well as false positive and false negative errors less than 15%. VF examinations were considered abnormal if pattern standard deviation (PSD) or glaucoma hemifield test was abnormal. Based on either of the following criteria [13], quadranopsia was defined.
1) Depression of thresholds by 5 dB or more, in three or more contiguous points adjacent to the vertical meridian in the involved quadrant as compared to their mirror image points across the vertical meridian.
2) The pattern deviation plot showed three or more points adjacent to the vertical meridian in the involved quadrant depressed to the 1% probability level with normal mirror image points across the vertical meridian.
For the diagnosis of hemianopsia, the diagnostic criteria for quadranopsia had to be applicable to both quadrants comprising the hemifield. To quantify the severity of VF defects, we used results for the mean deviation (MD) and PSD of both eyes. The tumor volume was assessed radiologically on a brain MRI by the same neuroradiologist. For the estimation of tumor volume, it was assumed that pituitary tumors had an ellipsoid form [14]. Using Cavalieri's principle, pituitary tumor volume was calculated after performing measurements of tumor diameter in three orthogonal planes, using the following formula: tumor volume = 4/3π (a/2·b/2·c/2) (where a,b, and c represent the diameters in the three dimensions).
Statistical analysis was performed using SPSS ver. 12.0 (SPSS Inc., Chicago, IL, USA). To compare groups, a chi-square test used for categorical variables and Mann-Whitney U-test were used for continuous variables. Pearson's correlation analysis was used to assess for relationships between tumor volume and MD and between tumor volume and PSD. All tests of association were considered statistically significant when p < 0.05.
Results
Among the 39 patients, 24 were male and 15 were female. The mean age was 45.8 ± 15.6 years, ranging from 19 to 86 years. The MD was -9.09 ± 6.85 dB and the PSD was 6.61 ± 4.15 dB. The baseline characteristics of the study participants are shown in Table 1.
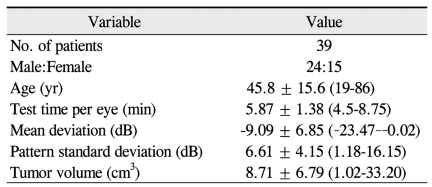
Baseline characteristics of the patients with pituitary macroadenoma
Types of VF defects in the patients are summarized in Table 2. Ten patients (26%) had normal VF and 29 patients (74%) had abnormal VF. Among the abnormal VF, seven patients (18%) had unilateral VF defects, and 22 patients (56%) had bilateral VF defects. Most of bilateral VF defects were bitemporal hemianopsia. Interestingly there were three patients with homonymous hemianopsia. These patients had a giant mass that involved the optic tract, one of which is shown in Fig. 1.
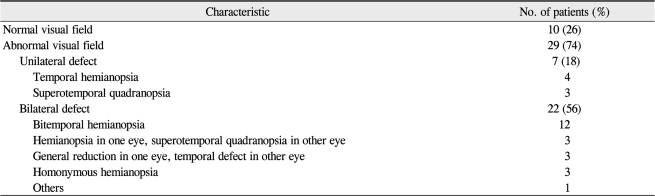
Types of visual field defects in patients with pituitary macroadenoma
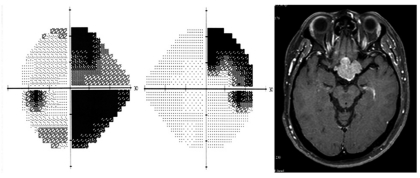
Humphrey visual field shows right incongruous homonymous hemianopia. Gadolinium-enhanced, T1-weighted magnetic resonance images of the brain reveal a mass that involves the optic tract.
A comparison between patients with and without VF defects linked to the pituitary macroadenoma is summarized in Table 3. There were no statistically significant differences in sex (p = 0.908) and age (p = 0.051) between the two groups. However, the tumor volume of the patients with VF defects was significantly larger than patients with normal VF (p = 0.006). In patients with VF defects, the MD was significantly lower (p < 0.001) and the PSD was significantly higher (p = 0.01) than patients with normal VF.

Comparison between patients with and without visual field defects
The correlation between MD and tumor volume is shown in Fig. 2. The tumor volume exhibited significant negative correlation with MD (r = -0.693; p < 0.001). The correlation between PSD and tumor volume is shown in Fig. 3. The tumor volume exhibited a significant positive correlation with PSD (r = 0.589; p < 0.001).
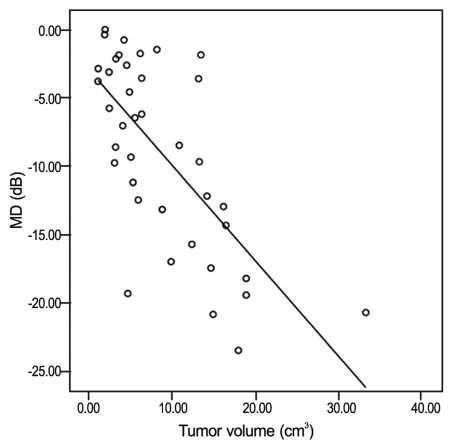
Correlation between mean deviation (MD) and tumor volume in patients with pituitary macroadenoma. Pearson correlation coefficient = -0.693, p < 0.001.
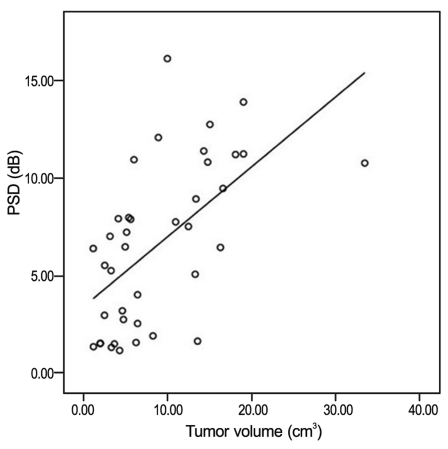
Correlation between pattern standard deviation (PSD) and tumor volume in patients with pituitary macroadenoma. Pearson correlation coefficient = 0.589, p < 0.001.
Discussion
Pituitary adenomas can cause visual loss or VF defects by compressing the optic chiasm or the optic nerve. Because lesions that damage the body of the optic chiasm characteristically produce bitemporal hemianopia [15], bitemporal field changes were the most common field defects on presentation in pituitary adenoma. However, according to tumor size and optic chiasmal position, a variety of field defects from monocular superior temporal defects to bilaterally constricted fields can be produced [6]. In our study, there were 29 patients (74%) with VF defects and bitemporal hemianopsia was also the most common type. In addition, there were seven monocular VF defects respecting the vertical meridian and three homonymous hemianopsia. Hershenfeld and Sharpe [16] reported that the cause of 64% of monocular hemianopsia was pituitary adenoma and several authors reported that it can cause homonymous hemianopsia [6,17]. Therefore brain imaging should be considered if patients showed not only binocular but also monocular VF defects respecting the vertical meridian.
Currently the automated perimetry is the gold standard for VF testing and most automated perimetry is superior to Goldmann perimetry in terms of sensitivity and quantification of the VF defects [7,18,19]. In addition, many studies showed that automated perimetry was comparable to Goldmann perimetry in detecting VF abnormalities in neurological diseases [7-9]. A recent study compared SITA Fast strategy with Goldmann perimetry in the detection and characterization of VF defects in neuro-ophthalmic practice [20]. They showed that the SITA Fast strategy was useful in detection and quantification of central VF defects, and might be preferable to Goldmann perimetry in patients with neuro-ophthalmic disorders.
There are few studies which evaluated automated perimetry in patients with pituitary adenoma [13,21] and these studies used the full-threshold strategy. An increased variability of the full-threshold strategy has been demonstrated in elderly populations and patients with VF defects [22,23]. In our study, we used a SITA strategy that was recently developed and shortens testing time for the standard Humphrey strategy but does not seem to affect variability [12]. It is known that increasing the test duration may influence the accuracy of the information obtained because of visual fatigue. For examination of the central 30° of VF in normal individuals, the SITA standard reduced the test time by up to 50% in comparison with the full-threshold strategy [24,25]. In our study, the average test time of the central 24° of VF was only 5.87 minutes per eye.
The relationship of pituitary tumor size and VF defects has been reviewed in several studies. Rivoal et al. [6] demonstrated that patients with VF abnormality had larger tumors and only the size of the adenoma was a significant factor for VF defects. Thomas et al. [13] demonstrated that the severity of field defects and visual loss were related to tumor size. Our results support those of previous studies that there is close correlation between tumor size and VF defects. However, we used different parameters from previous studies to evaluate a more accurate correlation. Because a tumor is a three dimensional structure, we measured the tumor by volume not by area. To quantify VF defects, we used the MD and PSD values of Humphrey perimeter. MD provides useful information concerning overall abnormality of a single field, as well as information regarding the worsening or improvement of fields over time. PSD shows the pattern of a localized abnormality [26]. Both of the parameters are expressed numerically, so those are useful to quantify the VF defects more accurately. Gedik et al. [21] also used the MD and PSD for evaluating VF defects and found there was no significant correlation between tumor size and MD or PSD. However different from our study, they used a 30-2 full-threshold strategy. As mentioned above, full-threshold strategy has some weaknesses and in the peripheral rim of points, a 30-2 program could have edge or lens rim artifact and response variability [26].
In summary, we used the SITA strategy to analyze VF of pituitary macroadenoma. Like the results of other VF programs, most of the VF defects were monocular or binocular hemianopsia respecting the vertical meridian. Furthermore, using the Humphrey parameters we measured VF defects quantitatively and there was a high correlation between the tumor volume and the severity of VF defects. We think the SITA strategy can be a fast and quantitative method in evaluating central VF defects of patients with pituitary macroadenoma.
Notes
This article was presented in part at the 100th autumn meeting of Korean Ophthalmological Society, October 2008, Goyang, Korea.
No potential conflict of interest relevant to this article was reported.