

There has been much controversy concerning the pattern of retinal nerve fiber layer (RNFL) damage in normal-tension glaucoma (NTG) and high-tension glaucoma (HTG) patients. Several studies have reported that NTG eyes often show a predominantly localized defect on the RNFL.1-3 This localized damage has been found to correspond to eccentric cupping, notching of the neuroretinal rim, disc hemorrhage and peripapillary choroidal atrophy, whereas diffuse damage corresponded to concentric cupping and homogenous pallor of the neuroretinal rim, as observed in HTG.3 In an evaluation of the RNFL damage pattern in HTG and NTG eyes using scanning laser polarimetry with fixed corneal polarization compensation, the RNFL thickness was found to be reduced symmetrically in the superior and inferior quadrants in HTG patients, whereas there was a more localized defect on the inferior RNFL in NTG patients.4 In contrast, others have reported no significant differences in the measured morphometric parameters of optic disc structure between HTG and NTG eyes using confocal scanning laser ophthalmoscopy.5-6 Using scanning laser polarimetry with fixed corneal compensation, the pattern of RNFL damage in NTG eyes with hemifield visual field defects was mixed and included diffuse or symmetrical loss of RNFL in both the upper and lower hemispheres, as well as focal loss in one hemisphere.6 Due to the considerable disagreement among glaucoma specialists, we quantitatively evaluated the patterns of RNFL measurements using scanning laser polarimetry with variable corneal compensation in NTG and HTG eyes. We also studied the sensitivity and specificity of scanning laser polarimetry with variable corneal compensation (GDx-VCC) in both groups.
Materials and Methods
We retrospectively reviewed the records of all patients who visited the glaucoma center at Asan Medical Center between August 2003 and February 2004. A total of 47 normal eyes of 47 normal patients and 99 eyes of 99 open angle glaucoma patients (49 NTG and 50 HTG) were studied. All patients were older than 40 years of age.
The mean age of the NTG group was 59.5 years (range 50-68 years). For inclusion, patients had to meet the following criteria: (1) untreated intraocular pressure (IOP) less than 22 mmHg, determined by multiple measurements using Goldmann applanation tonometry (GAT); (2) normal anterior chamber angle on slit-lamp biomicroscopy and gonioscopy in both eyes; (3) typical glaucomatous optic nerve appearance, consisting of focal or generalized narrowing or disappearance of the neuroretinal rim, disc hemorrhage, or vertical cup-disc asymmetry >0.2 between the eyes and a vertical cup/disc ratio (0.6; (4) visual acuity of 20/40 or better; (5) glaucoma visual field defect with humphrey field analysis (HFA) using central 24-2 or 30-2, with full threshold strategy defined as a corrected pattern standard deviation outside of the 95% normal limits and a glaucoma hemifield test outside of the 99% normal limits; (6) refractive error less than +/- 5D; (7) acceptable reliability indices in standard achromatic automated perimetry (SAP); (8) no history of surgical trauma or secondary causes of glaucoma; and (9) no other underlying neurological disease. Inclusion criteria were the same for the NTG and HTG groups, except that IOP with GAT upon multiple measurements before treatment was 22 mmHg or higher in the HTG group.
The mean age of the control group was 55.7 years (range 46-64 years). All patients had a best-corrected visual acuity of 20/40 or better. The normal appearance of the optic nerve head in both eyes was confirmed by ophthalmological examination. Absence of glaucomatous optic neuropathy was defined as a vertical cup-disc asymmetry less than 0.2 between the eyes, a vertical cup/disc ratio less than 0.6, and an intact neuroretinal rim without peripapillary hemorrhages, notches, localized pallor, or an RNFL defect. No other significant ocular diseases other than age-related mild cataracts were noted by routine ophthalmological examination. None of the control group had a history of IOP elevation above 21 mmHg by GAT or ocular trauma. All participants underwent visual field testing with a HFA using the program central 24-2 or 30-2, full-threshold strategy, and all had normal results. Normal visual field indices were defined as a corrected pattern standard deviation within 95% confidence limits and a glaucoma hemifield test result within normal limits. Visual field reliability criteria included less than 20% fixation losses in addition to false-positive and false-negative rates less than 20%.
Normal patients were matched to glaucoma patients by age. In both control and glaucoma patients, if both eyes met the inclusion criteria, one eye was randomly selected. The study protocol was approved by the Ethical Review Committee of the Asan Medical Center, Ulsan University College of Medicine.
Scanning laser polarimetry (SLP) imaging was performed using a commercial SLP-VCC (GDx-VCC; Laser Diagnostic Technology, San Diego, California, USA), which provides custom corneal compensation. While undergoing scanning, the pupil of each subject remained undilated. Scanning laser polarimetry imaging was performed using a scan circle of 3.2 mm in diameter centered on the optic disk, and the mean of three measurements was used. All images with a quality score grading of less than 8, automatically generated by the software based on alignment, refraction and fixation, were excluded. NFI (nerve fiber indicator: an indicator of the likelihood that an eye has glaucoma), temporal superior nasal inferior temporal (TSNIT) average (the average of thickness values in the calculation circle), quadrant average (average of all pixels in each quadrant of the calculation circle), quadrant maximum (average of the 210 thickest measurements in each quadrant), symmetry (ratio of the average of the 210 thickest measurements in the superior quadrant to the average of the 210 median measurements in the inferior quadrant), inter-eye symmetry (correlation of corresponding points from the TSNIT data for right and left eyes), superior/nasal ratio (superior quadrant/nasal quadrant), inferior/nasal ratio (inferior quadrant/nasal quadrant), maximal modulation (difference between the thickest and thinnest parts of the retinal nerve fiber layer), and ellipse modulation (maximal modulation along the ellipse) were selected as outcome variables for analysis.
Statistical analysis was performed using SPSS version 11.5 (SPSS Inc., Chicago, Illinois, USA). Analysis of variance (ANOVA) was used to determine the differences among the three groups of numerical values, and the comparison of different measures between each pair of the three groups was performed using the Post Hoc Tukey-Kramer test. We calculated the best sensitivity and specificity of each parameter using a ROC curve. Differences in sensitivity and specificity between NTG and HTG groups based on parameter were tested using a Chi test. A P-value of ≤0.05 was considered statistically significant.
Results
A total of 146 eyes (47 normal patients, 99 glaucoma patients) were evaluated in this study. The quality of all images obtained was satisfactory. Table 1 describes the demographic and clinical characteristics of the study population. There were no differences among the three groups with regard to age, visual acuity, refractive error, or central corneal thickness (CCT). Patients with glaucoma, however, had a significantly poorer visual field mean defect and corrected pattern standard deviation (P<0.05 by one way ANOVA).
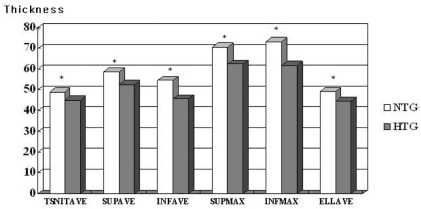
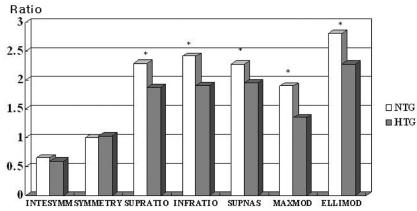
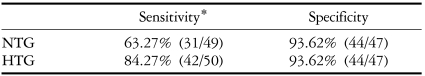
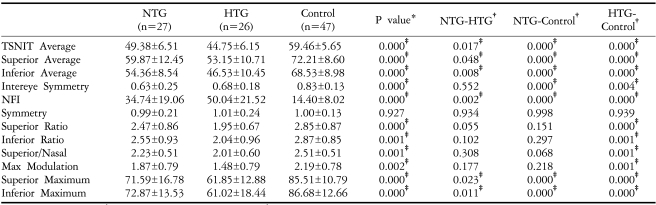
Table 2 shows the GDx-VCC parameters of the three groups. Except for symmetry, all parameters differed significantly among the three groups (P<0.05 by one way ANOVA). When we compared the control and NTG groups, we found that all thickness parameters (TSNIT average, superior average, inferior average, superior maximum, inferior maximum, and ellipse average) were significantly higher in the control group (P<0.05 by the Post Hoc Tukey-Kramer test), but the only significant differences in ratio parameters were the superior/nasal and inferior/nasal ratios. When we compared the control and HTG groups, all parameters except for symmetry were significantly higher in the control group (P<0.05 by Post Hoc Tukey-Kramer test). When we compared the NTG and HTG groups, all thickness parameters were significantly higher in the NTG group (P<0.05 by the Post Hoc Tukey-Kramer test) (Fig. 1), and the superior ratio, inferior ratio, superior/nasal ratio, maximal modulation, and ellipse modulation were significantly different (Fig. 2). The highest power parameter to discriminate between normal and glaucoma was NFI at a cutoff value of 27 (not shown). When we evaluated the sensitivity and specificity of NFI at a cutoff value 27 to detect HTG and NTG (Table 3), we found that its sensitivity for HTG was parameters were significantly higher in the NTG group significantly higher than for NTG (P<0.05 by Chi Square test).
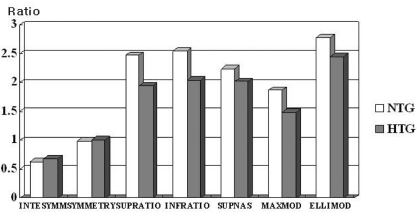
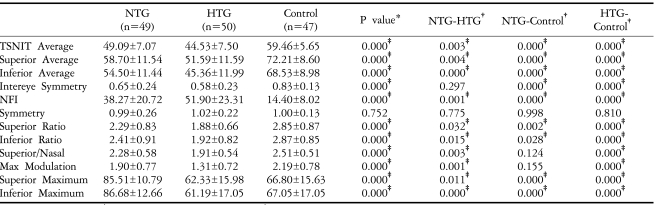
We also evaluated the same parameters for the early glaucoma patients (MD>-6 dB). Table 4 shows the demographic and clinical characteristics of patients with early stage glaucoma (MD>-6 dB). There were no differences among the three groups with respect to age, visual acuity, refractive error, or CCT. When we measured GDx-VCC parameters in the three groups of early stage glaucoma patients, we found that all parameters were significantly different except for symmetry (P<0.05 by one way ANOVA; Table 5). A comparison between the control group and the early stage NTG group showed that all thickness parameters (TSNIT average, superior average, inferior average, superior maximum, inferior maximum, and ellipse average) differed significantly (P<0.05 by Post Hoc Tukey-Kramer test), whereas none of the ratio parameters was significantly different. When we compared the control group with the early stage HTG group, we found that all parameters, except for symmetry, were significantly different (P<.05 by Post Hoc Tukey-Kramer test). Comparing the early stage NTG and early stage HTG groups, we found that all thickness (P<.05 by Post Hoc Tukey-Kramer test) (Fig. 3), but that there were no significant differences in any of the ratio parameters (Fig. 4).
We also evaluated the sensitivity and specificity of GDx-VCC to detect early stage HTG and NTG using NFI (nerve fiber indicator) at a cutoff value of 27 (Table 6). We found that its sensitivity in HTG was significantly higher than in NTG, both in early stage glaucoma patients as well as in total consecutive patients (P<0.05 by Chi Square test).
Discussion
Scanning laser polarimetry (SLP) provides an indirect measurement of RNFL thickness using the birefringent properties of retinal ganglion cell axons.7-9 As polarized light passes through the RNFL and is reflected back from the deeper layer, it undergoes a phase shift. The change in polarization, referred to as retardation, is proportional to the thickness of the birefringent medium, thus providing an index of RNFL thickness. The RNFL, however, is not the only source of birefringence in the eye, in that the cornea and the Henle fiber layer of the macula, and to a lesser extent the lens, are also birefringent. An anterior segment compensator is therefore incorporated within the technology to neutralize the polarization effects of the cornea and crystalline lens in SLP with fixed corneal compensation (GDx-FCC). This anterior segment compensator consists of a fixed retarder to adjust for corneal retardation and assumes that all individuals have a slow axis of corneal birefringence 15 degrees nasally downward and a magnitude of 60 nm. However, several studies have demonstrated that the magnitude and axis of corneal polarization are variable and can be strongly correlated with RNFL thickness assessments obtained by SLP.10 Because reliable peripapillary RNFL thickness measurements with SLP require separating RNFL birefringence from corneal birefringence, it is likely that improperly compensated measurements are a significant source of error with this technique.11-12 Several studies reported that inter-individual variability in corneal birefringence may lead to variable retardation measurements and a reduced sensitivity and specificity of this technology.13-15 Individualized corneal compensation decreases RNFL thickness values, as determined by SLP, compared with those determined with a fixed corneal compensator, thus significantly improving the area of under the ROC curve for thickness, but not for ratio parameters.16-17
We therefore measured normal and glaucoma patients with a GDx equipped so-called variable corneal compensator (VCC), which allows compensation for the anterior segment birefringence of each eye. Although several studies have used SLP with fixed corneal compensation to evaluate the pattern of RNFL damage in NTG and HTG patients, the limitations mentioned above were still present.
In the present study, we compared quantitative polarimetric measurements in age-matched NTG and HTG patients over 40 years of age using SLP (GDx-VCC). When we compared the NTG and HTG groups, we found that all thickness parameters were significantly lower in the HTG group, whereas the symmetry of the ratio parameters was not significantly different. In the age-matched early glaucoma patients, all thickness parameters were also lower at a statistically significant level in the HTG compared to the NTG group, whereas none of the ratio parameters differed significantly. In contrast to previous reports, we found that the ratio between the superior and inferior quadrant thicknesses, called symmetry, did not differ significantly between early stage or total NTG and HTG patients. When comparing age matched total glaucoma patients, the superior ratio, inferior ratio, superior/nasal parameters as well as all thickness parameters were significantly lower in the HTG group. Our study results showed that thickness parameters in both the superior and inferior quadrant were lower in the HTG compared to the NTG group, both in early stage and total age-matched glaucoma patients. This may suggest that RNFL damage is more diffuse in the HTG group than in the NTG group.
Ratio parameters consider the RNFL thickness profile in one region relative to another region, not the absolute value of RNFL retardation. For example, the superior ratio was the average of the 210 thickest measurements in the superior quadrant (120 degrees) divided by the average 210 median measurements in the temporal quadrant. Our study results indicate that ratio parameters were not very sensitive to the thickness parameter for the early detection of RNFL damage because it was not an absolute value but a relative ratio compensated by the nasal or temporal quadrant.
There have been several reports describing diffuse RNFL damage in eyes with localized visual field defects using psychophysical and structure-based methodologies.18-19 In addition, NTG eyes were reported to show a mixed pattern of RNFL damage, including diffuse or symmetrical loss of RNFL in both the upper and lower hemispheres, as well as focal loss in one hemisphere.6
We hypothesized that HTG is likely to cause more diffuse damage to the RNFL than does NTG. From our results, we cannot determine why HTG causes significantly more reduced retardation measurements and more diffuse RNFL damage than does NTG, especially since visual field defects based on HFA did not differ significantly. Our findings indicate that further research is necessary to determine the different mechanisms of RNFL damage in NTG and HTG.
We also evaluated the sensitivity and specificity of NFI in detecting NTG and HTG, both in early stage and total age-matched glaucoma patients. NFI is a global measure of both focal and diffuse retinal nerve fiber loss that utilizes neural networks, and is regarded as the most sensitive parameter for discriminating normal from glaucomatous eyes.20 When we calculated the receiver operating characteristics (ROC) for each RNFL parameter (not shown), we found that NFI had the strongest performance at a cutoff value of 27. The sensitivity of this method for detecting HTG was significantly higher than for NTG, both in the total as well as early glaucoma patients.
According to the study by Funaki et al,21 the cross sectional area occupied by the RNFL increased significantly with an increase in optic disc size. We did not consider the size of the optic disc and peripapillary atrophy in our study, which may affect our results. In addition, the greater mean deviation (MD) of the HTG group, although not statistically significant, may also affect our results.
In summary, we have shown here that, compared to eyes with NTG, eyes with HTG showed a reduced RNFL thickness and ratio parameters when patients were age and visual field matched. Sensitivity of glaucoma detection based on GDx-VCC (NFI) was better in eyes with HTG compared to NTG. Moreover, GDx-VCC appeared to be more sensitive in the detection of RNFL damage in HTG eyes.


 PDF Links
 PubReader
 Full text via DOI
 Full text via PMC
 Download Citation
 Print
Print


