The Relationship between Transcranial Doppler Ultrasonography and Visual Field Test Results in Glaucoma and Glaucoma Suspect Patients
Article information
Abstract
Purpose
To evaluate the relationships between parameters of transcranial ultrasonography and results of visual field tests in patients with open angle glaucoma or suspected of having glaucoma.
Methods
This retrospective study was based on data from medical records of patients who visited the Department of Ophthalmology in Kangbuk Samsung Hospital from January 1, 2016, to October 17, 2019, and underwent transcranial Doppler ultrasonography as part of a routine health examination. Ophthalmic data were visual acuity, intraocular pressure, optical coherence tomography, and Humphrey visual field test results. Retinal nerve fiber layer defect was confirmed by a glaucoma specialist. Patients’ ophthalmic data, such as average ganglion cell layer thickness, visual field index, pattern standard deviation, and mean deviation, were divided into quartiles. Each ophthalmic artery parameter from transcranial Doppler ultrasonography was compared between quartiles.
Results
A total of 162 patients were reviewed. There was no difference in Doppler ophthalmic artery (OA) parameters between patients with or without retinal nerve fiber layer defect. None of the quartile groups of average ganglion cell layer thickness showed significant difference in any OA parameters. Patients in the low–visual field index quartile showed significant low peak systolic velocities of OAs when adjusted for age, sex, and presence of diabetes mellitus or hypertension (p = 0.016). A higher pattern standard deviation showed lower peak systolic velocity (p = 0.046). There was no significant tendency between any other OA parameter and mean deviation value.
Conclusions
Our study suggests that hemodynamic parameters of ophthalmic arteries might be associated with visual field status of patients. Further large-population studies are needed in order to better understand the relationship between visual function and ocular blood flow.
Glaucoma is a disease of progressive optic nerve degeneration that results in structural damage of retinal nerve fiber layer (RNFL) and certain types of visual field defects. The proven treatment for glaucoma is to lower intraocular pressure [1]. This is based on the mechanism by which the mechanical stress of high intraocular pressure induces irreversible optic nerve damage [2]. However, some patients experience a worsening disease course even with well-regulated intraocular pressure [3]. Therefore, there are other possible causative risk factors in the pathophysiology of glaucoma [4].
Many studies have suggested that vascular factors are associated with the pathogenesis of glaucoma [5–9]. Some meta-analyses have demonstrated cardiovascular disease as a risk factor for open-angle glaucoma [5,6]. Other studies have focused on the decrease in blood perfusion of glaucoma patients compared with normal participants [7,8] and vascular dysregulation leads to low blood perfusion pressure and provokes ischemia and optic nerve damage [9].
Transcranial Doppler (TCD) was first developed in 1982 to noninvasively assess intracranial arteries. TCD can also measure ophthalmic artery (OA) blood flow velocity [10]. The main outcomes of TCD are mean velocity, peak systolic velocity (PSV), end diastolic velocity (EDV), pulsatility index (PI), and resistance index (RI). Mean velocity is the mean value over time in a heart cycle. PSV is the highest blood flow velocity in systole and local vasoconstriction results in increased PSV. EDV is the lowest blood flow velocity in diastole. Both increase in PSV and EDV refers to increased total volumetric flow. RI, calculated as “(PSV − EDV)/PSV,” ranges between 0 and 1. RI is often interpreted as vascular resistance, but it is uncertain in the retrobulbar vessels. PI, calculated as “(PSV − EDV)/(mean velocity),” is known to be the most sensitive parameter in differentiating abnormal waveforms [10]. Some published studies have used TCD to achieve better understanding of the vascular pathophysiology of glaucoma [10,11]. However, controversy exists over the relationships between TCD parameters and elements that reflect glaucomatous changes such as retinal nerve fiber layer thickness and visual field defect [12].
In this retrospective study, we assessed the association between OA parameters of transcranial sonography and ophthalmic exam values such as visual field and optical coherence tomography (OCT) in glaucoma and glaucoma suspect patients.
Materials and Methods
Ethics statement
This study was approved by the Institutional Review Board of Kangbuk Samsung Hospital (No. 2019-10-021-012) and adhered to the tenets of the Declaration of Helsinki. The requirement for informed consent was waived due to the retrospective design of the study.
Data collection
We reviewed medical record and physical examination data of patients who visited the Department of Ophthalmology of Kangbuk Samsung Hospital (Seoul, Korea) from January 1, 2016, to October 17, 2019, and underwent transcranial Doppler ultrasonography during routine health examination. Underlying disease information was collected from medical records. Ophthalmic data included visual acuity, intraocular pressure, spherical equivalent, thicknesses of average ganglion cell layer (GCL) and RNFL on OCT (Carl Zeiss Meditec Inc), and outcome indices from standard automated perimetry (24-2 Swedish Interactive Thresholding Algorithm [SITA] Standard; Humphrey Field Analyzer III, Carl Zeiss Meditec Inc) or frequency doubling technology (FDT) perimetry (Frequency Doubling Technology, Welch Allyn; Humphrey Matrix 24-2, Carl Zeiss Meditec Inc). These indices include visual field index (VFI), pattern standard deviation (PSD), and mean deviation (MD). Presence of RNFL defect, appearing as wedge-shaped defect or a dark stripe running towards optic disc on red-free fundus photography, was confirmed by a glaucoma specialist (JMK). Glaucoma was diagnosed when there are both glaucomatous optic disc damage (neuroretinal rim thining) on stereo disc photographs and corresponding visual field defects, and glaucoma suspect was defined as either one of the following results: (1) intraocular pressure >21 mmHg; (2) RNFL defects implicating glaucoma; (3) neuroretinal rim thining; (4) optic disc hemorrhage; and (5) visual field defect suspected of glaucomatous optic nerve damage. Both eyes of 162 patients (324 eyes) were included in this study. Images of poor quality, as defined by the following conditions, were excluded: (1) a signal strength index of <6 (range, 1–10); and (2) poor clarity. As a result, 315 eyes were included in the analysis between with and without RNFL defect groups because nine images of optic disc cube scan were excluded. The characteristics of 319 eyes are shown in the analysis between average GCL thickness groups, as five images of macular cube scan were excluded. Thirty-four patients did not undergo visual field test, and 14 patients performed frequency doubling technology perimetry (24-2 FDT Threshold; Humphrey Matrix), which does not show VFI. Unreliable visual field tests were also excluded, which show fixation losses >20%, false positive responses >15%, or false negative responses >15%. Data from TCD consisted of mean velocity, average PSV, average EDV, average PI, and average RI.
We compared all TCD OA parameters between groups with or without retinal nerve fiber defect. Ophthalmic data of average GCL thickness, RNFL thickness, VFI, PSD, and MD were divided into quartiles. Each parameter of the OA from TCD was compared between groups. Data from both eyes were included in this study, and we analyzed ophthalmic exam results of each eye with data from the same OA side.
Statistical analysis
Statistical analyses were conducted using Stata ver. 16.1 (Stata Corp). Independent two sample t-test was applied for comparison between OA parameter averages of two groups divided based on retinal nerve fiber defect. Analysis of covariance was used to adjust the data for confounding variables of age, sex, and presence of diabetes mellitus or hypertension. Analysis of variance was used to compare the average of quartile groups. We used a linear regression model to determine OA velocity trends based on each element of ophthalmic data.
Results
This study included data from 162 individuals who underwent transcranial Doppler sonography. As shown in Table 1, the mean age of the patients was 53.35 ± 9.97 years. Among total patients, 123 patients (75.9%) were male, 42 (25.9%) had diabetes mellitus, and 49 (30.2%) had hypertension.

Demographic characteristics of the study participants (n = 162)
There was no difference in Doppler OA parameters between patients with or without RNFL defect (Table 2). None of the average GCL thickness groups or RNFL thickness groups showed significant difference in any parameter (Tables 3, 4).

Difference of ophthalmic artery parameters between with and without RNFL defect groups (n = 315)

Difference of ophthalmic artery parameters between average GCL thickness quartile groups (n = 319)
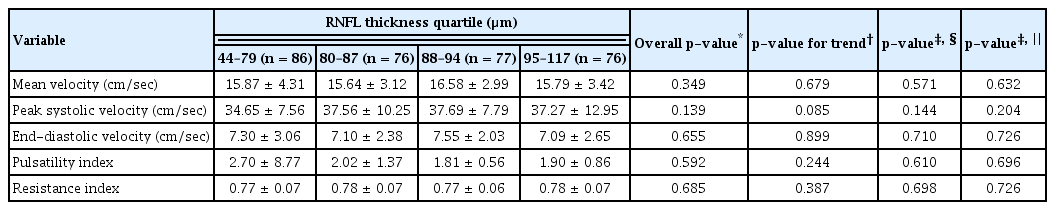
Difference of ophthalmic artery parameters between RNFL thickness quartile groups (n = 315)
Patients in the low-VFI quartile showed significantly low OA PSVs when adjusted for age, sex, and diabetes mellitus or hypertension (p = 0.016). There was a decreasing trend in mean OA velocity in association with lower VFI, but no significant difference was present when the data were adjusted for confounding variables (Table 5). There was no significant tendency between any other OA parameters and MD values (Table 6). Higher PSD appeared to be associated with lower PSV (p = 0.046), but the difference was not significant when the data were adjusted for age, gender, and presence of underlying diabetes or hypertension (Table 7).
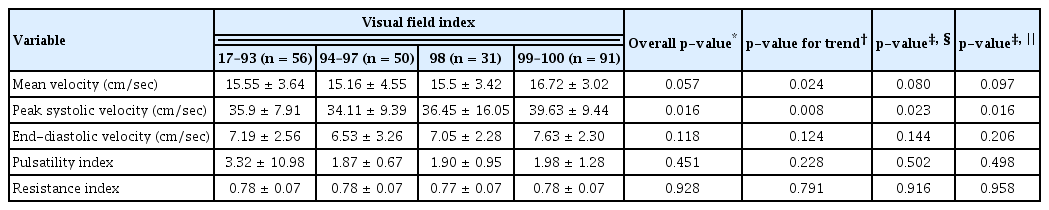
Difference of ophthalmic artery parameters between visual field index quartile groups (n = 228)

Difference of ophthalmic artery parameters between mean deviation quartile groups (n = 228)
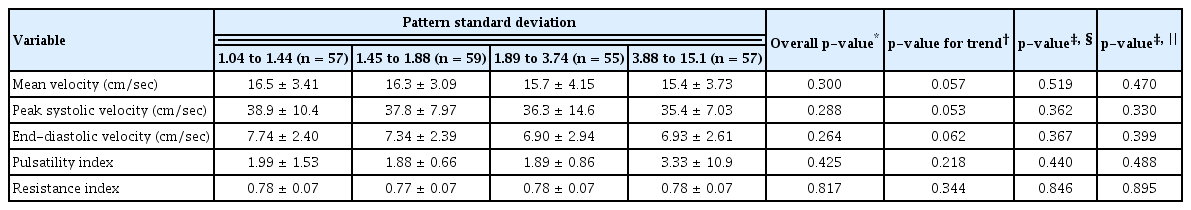
Difference of ophthalmic artery parameters between pattern standard deviation quartile groups (n = 228)
Discussion
This study showed a tendency for PSV to be lower in patients with lower VFI and higher PSD. The lower VFI group had lower PSV when the data was adjusted for age, sex, and presence of diabetes mellitus or hypertension. There was no significant difference in OA parameters and presence of RNFL defect or average thickness of the GCL.
Several studies have tested associations between TCD vascular parameters and glaucoma. However, there is no definite consensus concerning these associations due to inconsistent outcomes of those studies. In a cross-sectional study by Samsudin et al. [13] showed no difference in OA flow parameters, including PSV, between normal tension glaucoma (NTG) patients (n = 31) and control patients (n = 15). However, that study had a relatively small sample size, possibly too small to distinguish differences between the groups. Butt et al. [14] demonstrated that OA PSV was significantly higher in primary open-angle glaucoma (POAG) patients (n = 23, 40.4 ± 12.2 cm/sec) than in normal subjects (n = 26, 30.8 ± 10.6 cm/sec; p < 0.001) and postulated that this dynamic OA circulation would provoke shear stress and vascular endothelial damage over time. However, a prospective observational study by Tiwari et al. [12] showed that OA PSV was lower in POAG patients (n = 24, 18.2 ± 3.80 cm/sec) or NTG patients (n = 18, 26.6 ± 1.72 cm/sec) compared to control patients (n = 26, 35.4 ± 3.04 cm/sec; p < 0.0001), and suggested that decrease in blood flow velocity could be a sign of inappropriate autoregulation in glaucoma patients. Abegao Pinto et al. [15] conducted TCD analysis of retrobulbar arteries and found that ophthalmic artery PSV is lower in NTG patients (n = 89, 33.6 ± 11.2 cm/sec) and POAG patients (n = 102, 35.9 ± 13.9 cm/sec) than healthy subjects (n = 59, 40.1 ± 16.9 cm/sec). However, this difference was only significant between the NTG group and normal group (p = 0.02).
PSV is the first peak detected on the TCD waveform of each cardiac cycle [16]. High PSV is a sign of stenosis in cerebral arteries, which predicts the risk of stroke [17,18]. However, one study [19] revealed that PSVs of middle cerebral arteries in patients with severe extracranial internal carotid artery stenosis were in the low normal range or below, which suggests that low PSV of vessels could be the result of stenotic vascular conditions in vessels from which those arise. We speculated that certain stenotic conditions, such as atherosclerosis, of the internal carotid artery could decrease the OA PSV; the resulting hypoxic condition might affect visual function.
Another hypothesis is that vascular dysregulation results in chronic hypoperfusion [20]. Autoregulation represents the ability to maintain a certain range of blood flow in an organ regardless of cerebral perfusion pressure [21,22]. Altered autoregulation has been noted in deteriorating glaucoma patients [23]. The primary impact of disturbed autoregulation is volatile ocular blood flow, leading to reperfusion injury. The resulting oxidative stress is involved in the pathogenesis of glaucoma [24]. We postulated that impaired autoregulation of ocular blood flow may induce chronic hypoperfusion appearing as decreased OA PSV.
There are two prominent theories for pathogenesis of glaucoma. One is the mechanical theory that proposes that increased intraocular pressure pushes the lamina cribrosa backward and induces axonal damage [25]. The other is the vascular theory that has emerged due to the continuous progression of many glaucoma cases despite maintenance of intraocular pressure control. In the 19th century, some researchers suggested that an atrophic condition, such as vascular change, might lead to progression of glaucoma even after excessive mechanical stress is removed [25,26]. There are many techniques devised to study the hemodynamics of ocular circulation, but direct measurement of human ocular blood flow is limited with current technology [27]. First, fluorescein angiography is a minimally invasive method to evaluate retinal blood flow. Choriocapillaris blood flow pattern can be detected by indocyanine green angiography. The temporal resolution of scanning laser ophthalmoscopic angiography, which is applied in fluorescein angiography and indocyanine green angiography, allows visualization of hyperfluorescent or hypofluorescent portions in optic nerve head vasculature. An image analysis system can calculate the velocity of dark and light segments [27,28]. However, the diameters of capillaries are too tiny for blood flow to be measured; and there is no known way to obtain blood flow values in those vessels [27]. Second, OCT angiography (OCTA) is a noninvasive and dyefree imaging technique that enables assessment of vessel structure in the optic nerve head [29]. Glaucoma specialists demonstrated that glaucomatous eyes have lower vessel densities compared to normal ones [30]. Even though OCTA has become a promising modality to study vascular factors in glaucoma, the technique has some drawbacks, such as artifacts that create poor image quality and interrupt interpretation [31]. Furthermore, OCTA detects moving red blood cells and generates a structural image of vasculature but does not provide blood flow speed information [32]. TCD has been applied to measure blood flow velocity profiles of vascular structures in the orbit [27]. TCD is a widely available technique due to its noninvasive nature and relatively low cost [33]. TCD can obtain well-identified signals from specified depths and sectors with little attenuation [34]. In 1993, Rojanapongpun et al. [35] demonstrated acceptable reproducibility of TCD for OA velocity and suggested TCD as a clinical tool to estimate OA parameters. We used TCD results in this study because the method is not only easily applicable to the general population in routine health examination settings, but also provides reliable parameters of OA velocities.
There are several limitations that should be considered in this study. First, the outcomes are not consistent; there are discrepancies among VFI, PSD, and MD, possibly due to variable characteristics of the study population. The upper 75% of patients have MD values of −4.05 to 4.70, indicating that three-fourths of the study population were either early glaucoma patients or normal subjects, who might demonstrate not significant differences in OA parameters. Further studies that contain groups in each stage of glaucoma, as well as normal subjects, are necessary. Second, due to the cross-sectional design of this study, we could not conclude a cause-and-effect relationship between OA velocities and visual field results. Prospective observational studies are needed to demonstrate vascular effects on glaucomatous functional damage. Third, modalities of the visual field tests were not fully uniform in this study. There are controversies about compatibility between SITA standard and FDT results. Doozandeh et al. [36] demonstrated there was no agreement between results of FDT and SITA standard regarding MD (p = 0.905) and PSD (p = 0.169) among 47 subjects, asserting FDT cannot be used interchangeably with SITA standard in the mild stage of glaucoma. On the other hand, a larger scale study [37] showed FDT results were highly comparable with SITA standard results in ocular hypertension and glaucoma group (n = 85; MD: r = 0.66, p < 0.001; PSD: r = 0.69, p < 0.001). Additional studies using each visual field test modality are required to eliminate uncertain possibility due to discrepancy of visual field modalities.
In our study, we introduced possible relationships between TCD OA velocity parameters and indices of visual field results, indicating that the OA TCD exam might be a useful noninvasive tool to predict visual function. Also, this outcome shows that functional deterioration could precede definite structural damage from inadequate ocular blood supply. Unstable ocular blood flow caused by reduced PSV in OA could potentially contribute to metabolic disturbances, such as reduced energy production or impaired neurotransmission, affecting functional integrity of visual system without detectable structural damage. These vascular insults gradually degenerate ganglion cells, not abruptly inducing irreversible cell death. In such cases, the conventional structural imaging technique like OCT may not reveal obvious GCL damage or RNFL defect even with visual field deterioration. Ophthalmologists and other physicians need to be aware of this in their glaucoma assessments.
Most related studies have identified vascular insufficiency in glaucoma patients [38]. Decreased perfusion to the brain has been suggested to be associated with visual field deficits [39]. Likewise, our study suggests that hemodynamic OA parameters might be associated with the visual field status of patients. Further large-population prospective studies are needed in order to better understand the relationship between visual function and ocular blood flow.
Acknowledgements
None.
Notes
Conflicts of Interest
None.
Funding
None.