


Cataract surgery is the one of the most performed surgical procedures worldwide. As the demand for better vision rapidly increases, efforts have also been made by researchers to improve the quality of vision after the surgery. The refractive outcome is one of the main factors related to patientsŌĆÖ visual satisfaction, and this depends on the preoperative measurements of axial length (AL), keratometry, anterior chamber depth (ACD), and the accuracy of intraocular lens (IOL) power calculation formulas.
To improve the accuracy of calculation of postoperative refraction, further attempts have recently been made to update preexisting formulas or create new methods. These newer formulas have been shown in several studies to have superior outcomes in comparison to older ones such as SRK/T, Holladay 1, and Hoffer Q formulas [1,2]. The well-known Barrett Universal II (BUII) formula is a widely used theoretical model which has been shown to be one of the most accurate formulas by several studies [3,4]. The Emmetropia Verifying Optical (EVO) formula is a thicklens formula based on the theory of emmetropization. The Hill-RBF calculator employs pattern recognition by artificial intelligence, and version 3.0 has been released in 2020, incorporating more variables. The Kane formula, which combines artificial intelligence with theoretical optics, was shown to have significant improvement over preexisting IOL formulas in short and long eyes [5]. The Hoffer QST formula is an updated version of the Hoffer Q formula using artificial intelligence, aimed to improve its accuracy along the entire AL spectrum [6]. The PEARL-DGS formula, which is based on thick-lens equations and uses machine learning models to predict the posterior corneal radius and the theoretical internal lens position, has been shown to achieve an accuracy comparable to other state-of-the-art IOL formulas [7].
The accuracy of these formulas may also differ depending on the optical characteristics of the eye such as the AL and corneal power. Some newer formulas such as BUII and Kane have been shown to have good performance in long eyes by several studies [4,5,8-10]. On the other hand, the refractive accuracy tends to be lower in short eyes with recent studies showing little difference among the various formulas [11,12].
The European Society of Cataract and Refractive Surgeons (ESCRS) IOL Calculator, which enables one to compare the performance of several new formulas at a glance, has been recently introduced. The purpose of the current study was to compare the accuracy of six modern IOL formulas to determine which best predicts the postoperative refractive outcome: BUII, EVO 2.0, Hill-RBF 3.0, Hoffer QST, Kane, and PEARL-DGS. A subgroup analysis according to the AL was conducted. In addition, we evaluated whether the prediction error calculated by each formula is correlated to AL and corneal power.
Materials and Methods
This retrospective cross-sectional study included Korean patients who underwent cataract surgery at Yeouido St. MaryŌĆÖs Hospital between March 2018 and August 2022. All patients signed an informed consent and agreed to receive the surgery. The protocol of the study followed the principles of the Declaration of Helsinki and was approved by the Institutional Review Board of Yeouido St. MaryŌĆÖs Hospital (No. SC23RISI0071).
The inclusion criteria were patients with uncomplicated cataract who underwent uneventful phacoemulsification and posterior chamber IOL insertion. Patients with a history of ocular trauma, previous ocular surgery, corneal disease, and those with intraoperative or postoperative complications that may affect the refractive outcome were excluded from the study.
The enrolled patients were measured preoperatively using IOLMaster 500 (Carl Zeiss Meditec) to assess AL, corneal power (K), and ACD. ACD was measured from the corneal epithelium to the lens. Autorefraction was measured using autokeratometer RF-F1 (Canon) and was confirmed by subjective refraction preoperatively and postoperatively at least 1 month after surgery. All surgeries were performed by a single surgeon (WJW) by 2.2-mm clear corneal temporal incision followed by phacoemulsification and posterior chamber IOL insertion. The monofocal 1-piece IOL, TECNIS ZCB00 (Johnson & Johnson Vision) was used.
The predictive refraction was calculated by entering the biometric values measured with IOLMaster 500 into six IOL power calculation formulas using the ESCRS IOL Calculator: BUII, EVO 2.0, Hill-RBF 3.0, Hoffer QST, Kane, and PEARL-DGS. The formula-recommended lens constants were used. The A-constant was 119.39 for BUII, 119.3 for EVO and PEARL-DGS, 119.34 for Hill-RBF, and 119.36 for Kane. The pseudophakic ACD was 5.60 for the Hoffer QST formula. Since IOLMaster 500 does not provide lens thickness (LT) and central corneal thickness (CCT) values, Cooke K6 formula was excluded from the analysis.
The refractive prediction error (PE) was defined as the difference between the actual postoperative spherical equivalent and the refractive result predicted by each formula for the IOL implanted. After adjusting the mean PE to 0 [13], the standard deviation (SD) of PE, mean absolute error (MAE), and median AE (MedAE) were calculated for each formula. With reference to a previous study by Melles et al. [9], the study population was separated into three subgroups by AL: short (<22.5 mm), medium (22.5-25.5 mm), and long (>25.5 mm).
The percentage of eyes with an adjusted PE value within ┬▒0.50 and ┬▒1.00 diopters (D) were calculated for each formula. We calculated the IOL Formula Performance Index (FPI) as recommended by Hoffer and Savini [14] to rank the accuracy of the formulas. The formula is shown below, where ŌĆ£nŌĆØ is the percentage of eyes with a PE value within ┬▒0.50 D and ŌĆ£mŌĆØ is the slope of the correlation between PE and the AL. The higher the FPI is, the more accurate the formula.
IBM SPSS ver. 29.0 (IBM Corp) was used for statistical analysis. The comparison of absolute PE was performed using the Friedman test. The percentage of eyes with an adjusted PE value within ┬▒0.50 and ┬▒1.00 D, respectively, was compared by Cochran Q test with McNemar test as a post hoc test. Bonferroni correction was applied for multiple comparisons of the formulas. The correlations between the PE calculated by each formula to the AL and corneal power were evaluated using linear regression analysis. A statistically significant difference was defined as p < 0.05.
Results
A total of 203 eyes from 203 patients were included in the study. The demographics and biometric characteristics of the study population are shown in Table 1. The mean AL was 24.13 ┬▒ 1.52 mm, the mean corneal power was 44.06 ┬▒ 1.34 D, and the mean ACD was 3.26 ┬▒ 0.41 mm. The percentage of eyes with short, medium, or long AL were 8.4%, 74.4%, and 17.2%, respectively.
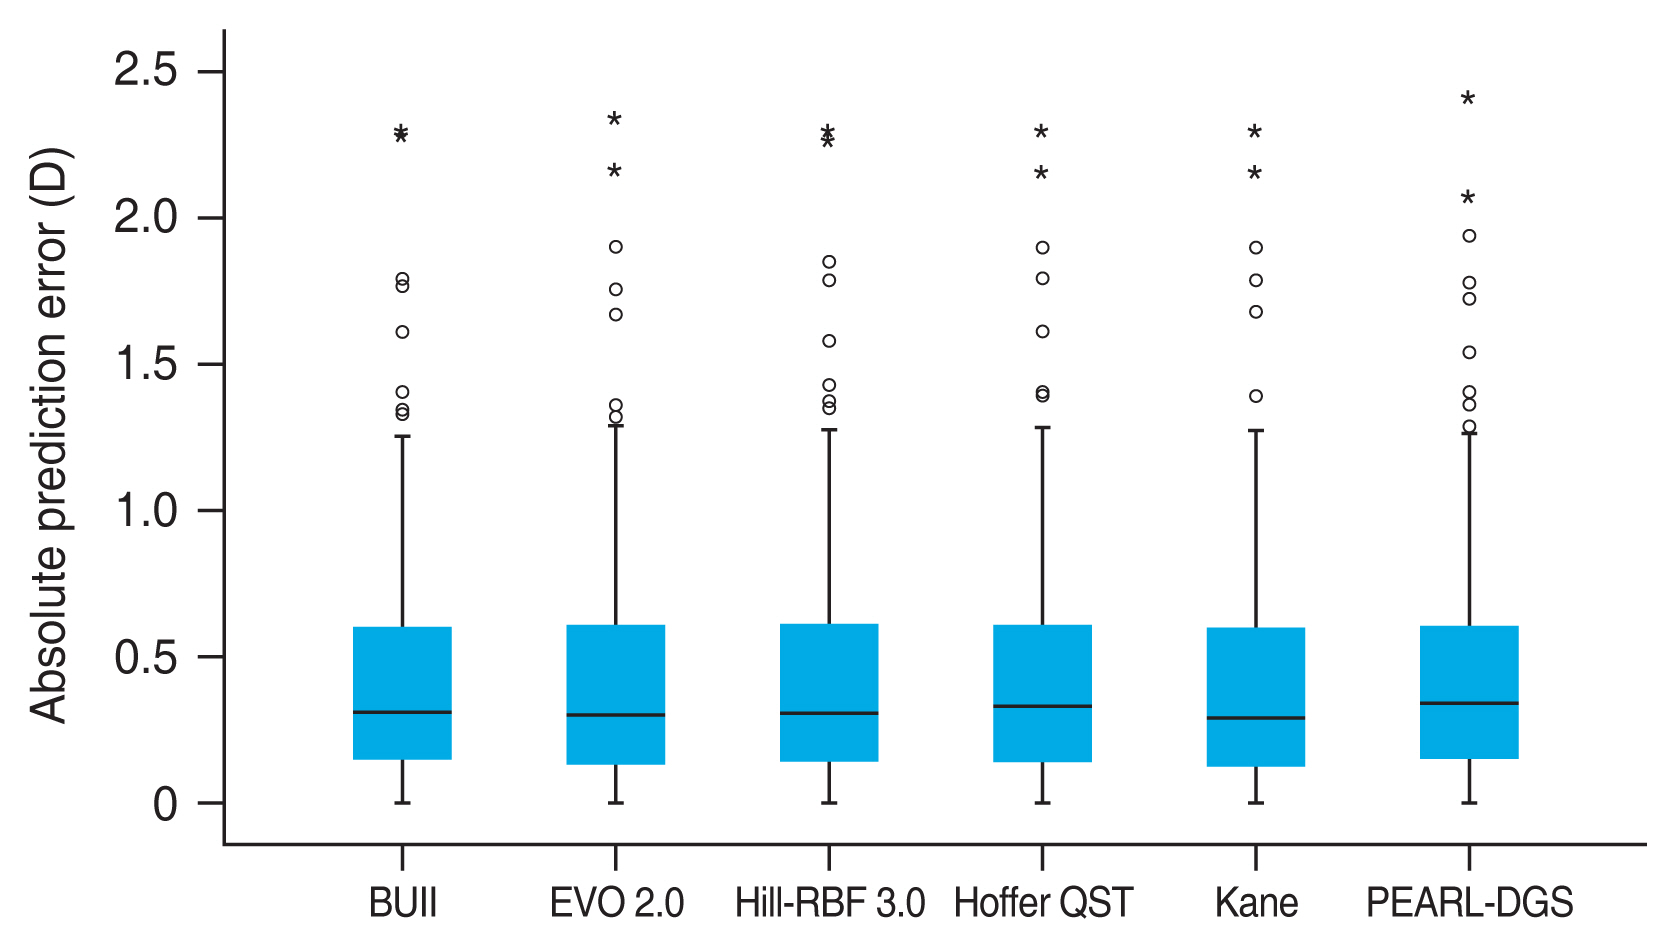
Table 2 shows the refractive outcomes of each formula after adjusting the PE to 0. Overall, there was no significant difference regarding the MAE between the formulas (p = 0.058). The distribution of AE is illustrated in Fig. 1. The MAE and MedAE for each AL subgroup is shown in Table 3. There was no significant difference between the formulas in eyes with short, medium, and long AL (p = 0.750, p = 0.107, and p = 0.435, respectively).
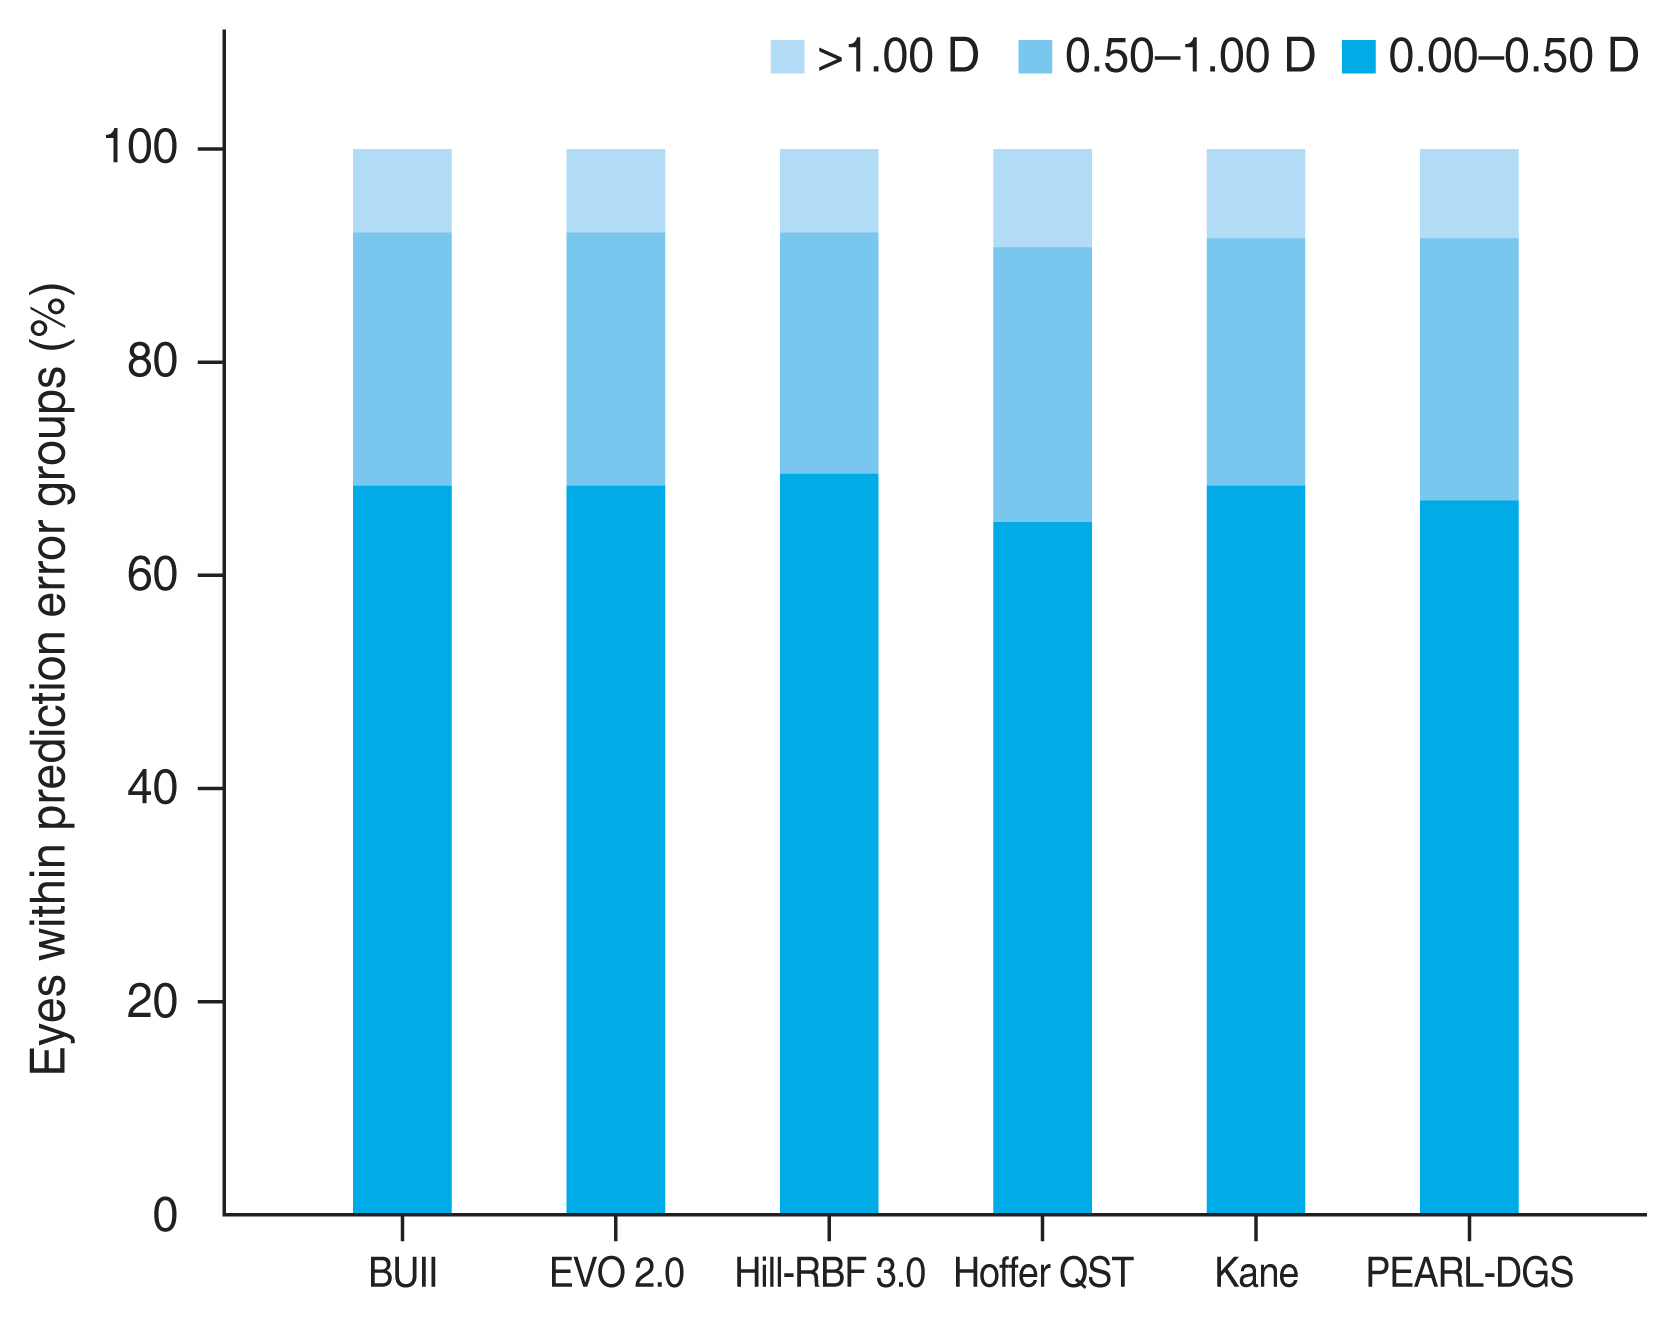
The percentage of eyes with PE within ┬▒0.50 and ┬▒0.10 D are presented in Table 2 and Fig. 2. The BUII and Hill-RBF 3.0 formulas had the highest percentage of eyes with PE within ┬▒0.50 D. The percentages of eyes within ┬▒0.50 D of error were significantly different among the six formulas by Cochran Q test (p = 0.033). Post hoc analysis using McNemar test was performed, and the BUII and Hill-RBF 3.0 formulas achieved a higher percentage of eyes with PE within ┬▒0.50 D when compared to the Hoffer QST formula (p = 0.022 and p = 0.035, respectively). However, no statistical difference was noted after Bonferroni p-value adjustment. The accuracy of the IOL power calculation formulas was also ranked by calculating the FPI. The BUII formula ranked the highest, followed by PEARL-DGS, EVO 2.0, Kane, Hill-RBF 3.0, and Hoffer QST, in the order of decreasing accuracy (Table 2).
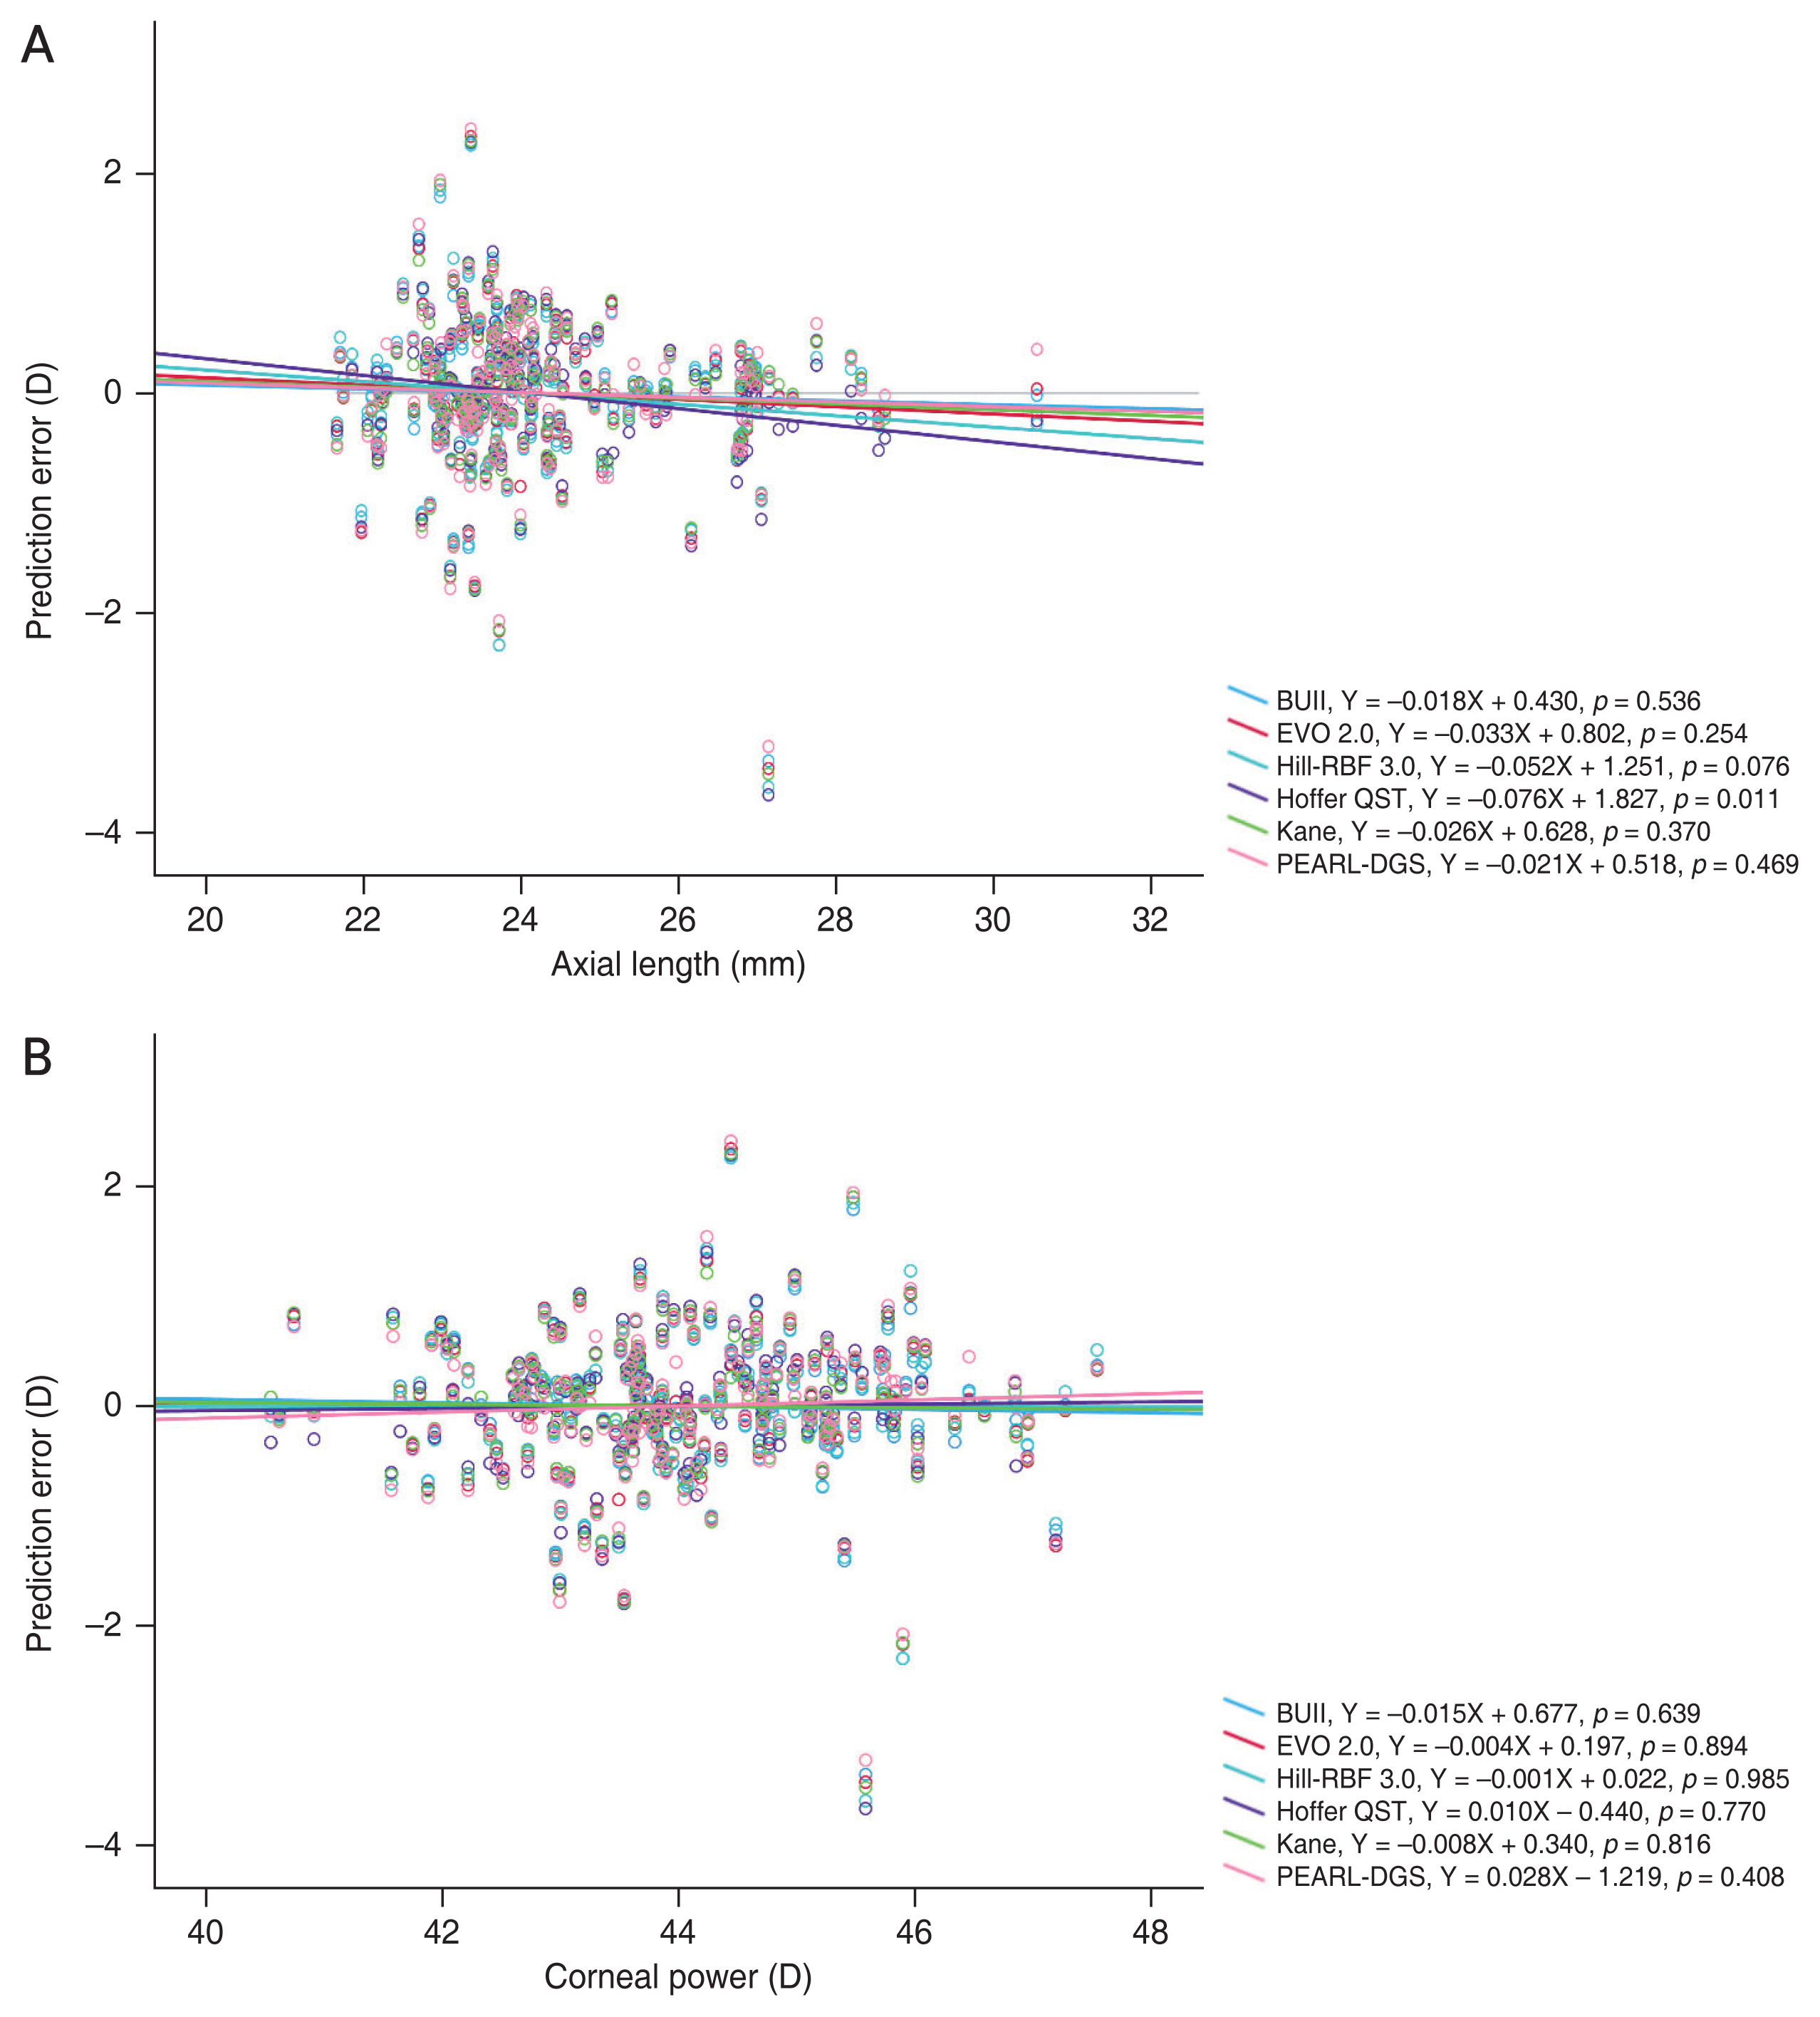
Out of the six formulas, only the Hoffer QST formula showed a significant correlation between its PE and the AL on linear regression analysis (p = 0.011). All six formulas showed no significant correlation between their PE and the corneal power (Fig. 3).
Discussion
The present study was designed to investigate and compare the accuracy of modern IOL power calculation formulas in ESCRS calculator. To our knowledge, this is the first study to compare the BUII, EVO 2.0, Hill-RBF 3.0, Hoffer QST, Kane, and PEARL-DGS formulas regarding a single type of IOL. After adjusting the mean PE to 0, the six formulas showed comparable accuracies in terms of their absolute prediction errors. Although not statistically significant, BUII performed better in short eyes while EVO 2.0 stood out in long eyes compared to other formulas.
Five out of six formulas achieved a PE of ┬▒0.50 D or less in at least 67.0% of eyes, and all six formulas achieved at least 90.6% of PE within ┬▒1.00 D. This proportion is well above the benchmark standard proposed by Gale et al. [15], indicating that these modern formulas all provide an excellent prediction of refractive outcomes. Among the six formulas, the BUII and Hill-RBF 3.0 formulas showed a higher percentage of PE within ┬▒0.50 D when compared to the Hoffer QST formula (p = 0.022 and p = 0.035, respectively). When ranked by the FPI score, the BUII formula held the first place with Hoffer QST being the last.
There have been several studies in which BUII formula was proven to be more accurate in terms of refractive outcomes when compared to the traditional formulas [4,8,16]. Recent studies reported that the BUII formula still performs well when compared to the newer generation formulas. In one study, the BUII formula showed a smaller percentage of refractive surprises when compared to that of the initial version of the Hill-RBF formula in addition to the third-generation formulas [16]. The recently developed Hill-RBF 3.0 formula was shown to be more accurate than its earlier form, and has similar prediction accuracy to BUII, EVO 2.0, Kane, and Olsen formulas [17]. The new Hoffer QST formula has also been shown to be better than the original HQ formula, and has comparable accuracy to BUII, EVO, Kane, and Hill-RBF 3.0 formulas with respect to refractive error [6]. Overall, these findings are congruent with ours that modern and recently developed newer generation IOL power calculation formulas all perform well with similar prediction accuracies. Since different variables are used for comparing the accuracy of the formulas, further validation and incorporation of the FPI in future studies may provide more consistent results.
Previous studies have reported that as ALs reach the extremes, the deviation of IOL power significantly increases [8]. In our analysis, there was no significant difference in the absolute prediction errors calculated by different formulas in each subgroup. There is less accumulated data regarding the accuracy of newer formulas in eyes with extreme AL. In one study, the BUII was shown to have the least bias across a range of AL out of seven formulas [9]. In another study, the Kane formula was shown to be more accurate in each AL subgroups than eight other formulas including the BUII and Hill-RBF 2.0 formulas [5,10]. A recent report showed that the EVO 2.0 and Kane formulas achieved better results in patient with high axial myopia in comparison to BUII [18].
In this study, we also evaluated whether the refractive outcomes predicted by each formula are affected by different biometric factors. One large scale study which compared the third and fourth-generation formulas reported that most of the formulas have notable biases in relation to AL, keratometry, ACD, or LT, except for the BUII formula [17]. Our analysis of the newer formulas showed that only the Hoffer QST formula has a bias with varying AL, and that none of the six formulas have a significant correlation with the corneal power. This indicates that we may expect for a more reliable outcome from these recently developed formulas for eyes with a wide range of ocular dimensions.
Our study has several limitations. Firstly, the absence of additional values such as LT and CCT may have affected our conclusion about formula accuracy. However, these are optional variables for the formulas of interest, and it has recently been demonstrated that LT does not improve the refractive results of modern formulas in cataract patients [19]. Another limitation is that we only evaluated a single type of IOL; different results may arise from different IOL models. Lastly, since our data included a low number of eyes with short and long AL due to standard population variation, further investigation with a larger sample size is required to confirm the current finding.
In conclusion, the BUII, EVO 2.0, Hill-RBF 3.0, Hoffer QST, Kane, and PEARL-DGS formulas all provide a decent prediction of refractive outcomes. Further research concerning other types of IOL and a larger sample size of eyes with extreme biometric values must be done to solidify our findings.
 PDF Links
 PubReader
 ePub Link
 Full text via DOI
 Full text via PMC
 Download Citation
 Print
Print


