Fractal Dimension of Peripapillary Vasculature in Primary Open- Angle Glaucoma
Article information
Abstract
Purpose
To compare the fractal dimensions of the peripapillary microvasculature as obtained by optical coherence tomography angiography (OCTA) between primary open-angle glaucoma (POAG) and controls.
Methods
Optic nerve head and peripapillary area images were taken using the 20° × 20°-scan of Spectralis OCTA (Heidelberg Engineering) in 97 subjects (64 POAG patients, 33 control patients). The optic nerve head microvasculature was evaluated according to predefined slabs: the superficial vascular complex (SVC) and the avascular complex (AVC). The en face image of each slab was processed by ImageJ software (National Institutes of Health) in order to calculate the vessel density and the fractal dimension using the box-counting method. For comparison, the peripapillary retinal nerve fiber layer (RNFL) thickness was obtained from Spectralis OCT circle scans. The utilities of the parameters for discriminating between the POAG and control groups were assessed using areas under the receiver operating characteristic curves (AUCs).
Results
The SVC fractal dimension was lower in the POAG than in the control group (p < 0.001), while AVC showed no inter-group difference (p = 0.563). The fractal dimension showed a good correlation with the vessel density in both SVC and AVC (both p < 0.001). In a multivariable regression analysis, the SVC fractal dimension was negatively correlated with age (p < 0.001) and axial length (p < 0.001) and positively correlated with average RNFL thickness (p < 0.001), while the AVC fractal dimension was positively correlated with the Bruch’s membrane opening size (p = 0.013). In terms of diagnostic utility, the AUC was significantly larger for the average RNFL thickness (AUC, 0.889) than for the SVC fractal dimension (AUC, 0.772; p = 0.008).
Conclusions
The fractal dimension of SVC was associated with the average RNFL thickness and was reduced in POAG patients. Fractal dimension analysis could be used in evaluating peripapillary vascularity by OCTA.
The peripapillary microvasculature is a subject of great interest with regard to optic nerve head (ONH) evaluation for glaucoma assessment. Glaucoma patients suffer reduced peripapillary retinal blood flow [1,2], which can be interpreted either as an etiologic factor [3–5] or the consequence of diminished metabolic demand due to glaucomatous optic neuropathy [1,2,6,7]. With the advent of optical coherence tomography angiography (OCTA), the peripapillary microvasculature could be visualized noninvasively without dye injection, which advance has prompted many studies in which primary open-angle glaucoma (POAG) patients are consistently reported to have reduced peripapillary microvasculature density [8–11].
Vascular density findings, however, are affected by image scale and resolution. And, due to the detection limit of a vessel size, a microvasculature smaller than the limit would be overlooked when calculating vascular density. This problem can be handled by the use of fractal analysis. Fractal analysis fills the overlooked area with multiple levels of subunits that resemble the structure of the entire object. The fractal dimension, as a noninteger between 1 and 2, describes the lacunarity of space: that is, it shows how densely a space is filled without being affected by the scale and resolution limit. Fractal analysis and the fractal dimension have been used for evaluation of retinal vasculature in many studies [12–21]. To the best of our knowledge, however, there has been no evaluation of OCTA based peripapillary microvasculature using fractal dimension analysis. The purpose of this study, then, was to compare the fractal dimension of the peripapillary microvasculature between POAG and control eyes in order to present a novel ONH parameter representing peripapillary vascularity.
Materials and Methods
Ethics statement
The study protocol was approved by the Institutional Review Board of Seoul Metropolitan Government Seoul National University Boramae Medical Center and adhered to the tenets of the Declaration of Helsinki. Written informed consent to participate was obtained from all of the subjects.
Study design
This investigation included subjects who had been enrolled in the Boramae Glaucoma Imaging Study (BGIS), an ongoing prospective study at the Seoul Metropolitan Government Seoul National University Boramae Medical Center. It registered the anatomic features of the ONH in subjects who had visited our institution with either a diagnosis of glaucoma or suspicion of glaucoma.
Subjects who had been enrolled in the BGIS underwent comprehensive ophthalmologic examinations that included best-corrected visual acuity assessment, refraction, slitlamp biomicroscopy, Goldmann applanation tonometry, gonioscopy, dilated funduscopic examination, keratometry (RKT-7700; Nidek, Hiroshi, Japan), axial length measurement (IOLMaster ver. 5; Carl Zeiss Meditec, Dublin, CA, USA), disc photography along with red-free fundus photography (TRC-NW8; Topcon, Tokyo, Japan), standard automated perimetry (Humphrey Field Analyzer II 750, 24-2 Swedish Interactive Algorithm; Carl Zeiss Meditec), as well as spectral domain OCT and OCTA (Spectralis OCT; Heidelberg Engineering, Heidelberg, Germany).
Glaucomatous optic nerve damage was defined as rim thinning, notching, and/or the presence of RNFL defects, and was evaluated by two glaucoma specialists (KML and SHK). POAG was defined as glaucomatous optic nerve damage and associated visual field defects with an open iridocorneal angle (in the case of cataract surgery, the angle was confirmed preoperatively). Glaucomatous visual field defect was defined as (1) outside normal limits on glaucoma hemifield test, (2) three abnormal points, with a p-value less than 5% probability of being normal and one with a p-value less than 1% by pattern deviation, or (3) pattern standard deviation of less than 5%. Visual field defects were confirmed on two consecutive reliable tests (fixation loss rate of 20%, and false-positive and false-negative error rates of ≤25%). The control group was enrolled from subjects who had been referred as glaucoma suspect but had an intraocular pressure of ≤21 mmHg, a normal optic disc appearance, an open iridocorneal angle, normal red-free fundus photography, and a normal visual field.
The inclusion criteria were POAG patients and control patients. The exclusion criteria were best-corrected visual acuity <20 / 40, a history of ocular surgery other than cataract extraction or corneal refractive surgery, retinal or neurologic disease other than glaucoma that could cause visual field defect, and poor-quality OCTA imaging (quality score, <25). When both eyes were eligible, one eye was randomly selected for the analysis.
Optical coherence tomography angiography
The optic nerve and peripapillary area were imaged using a commercially available OCTA device (Spectralis OCT) with a central wavelength of 880 nm, an acquisition speed of 85 kHz, and lateral and axial resolutions of 5.7 and 3.9 μm/pixel, respectively. Spectralis OCTA uses a full-spectrum probabilistic approach that computes the probability that a given pixel follows the OCT signal distribution of the perfused vasculature rather than that of static tissue, which affords an almost binary high-contrast image appearance [22]. Scans were obtained from a 20° × 20°-pattern consisting of 512 clusters of five repeated B-scans centered on the optic disc.
To evaluate vascular plexuses, we used predefined slabs of Spectralis OCTA: the superficial vascular complex (SVC; between the inner limiting membrane and constant offsets from the inner plexiform layer) and the avascular complex (AVC; between the outer plexus layer and the Bruch’s membrane opening [BMO]) [22]. En face images of the predefined Spectralis OCTA slabs were used for the analysis.
Fractal dimension calculation
Images were processed using ImageJ software (National Institutes of Health, Bethesda, MD, USA) (Fig. 1A–1H). First, a nonlocal means denoising filter was applied to reduce the background noise (Fig. 1G). Second, gray-scale images were evaluated for the fractal dimension using the box-counting method provided by the Multifrac plugin of ImageJ software (Fig. 1H) [23]. Box counting relies on the equation
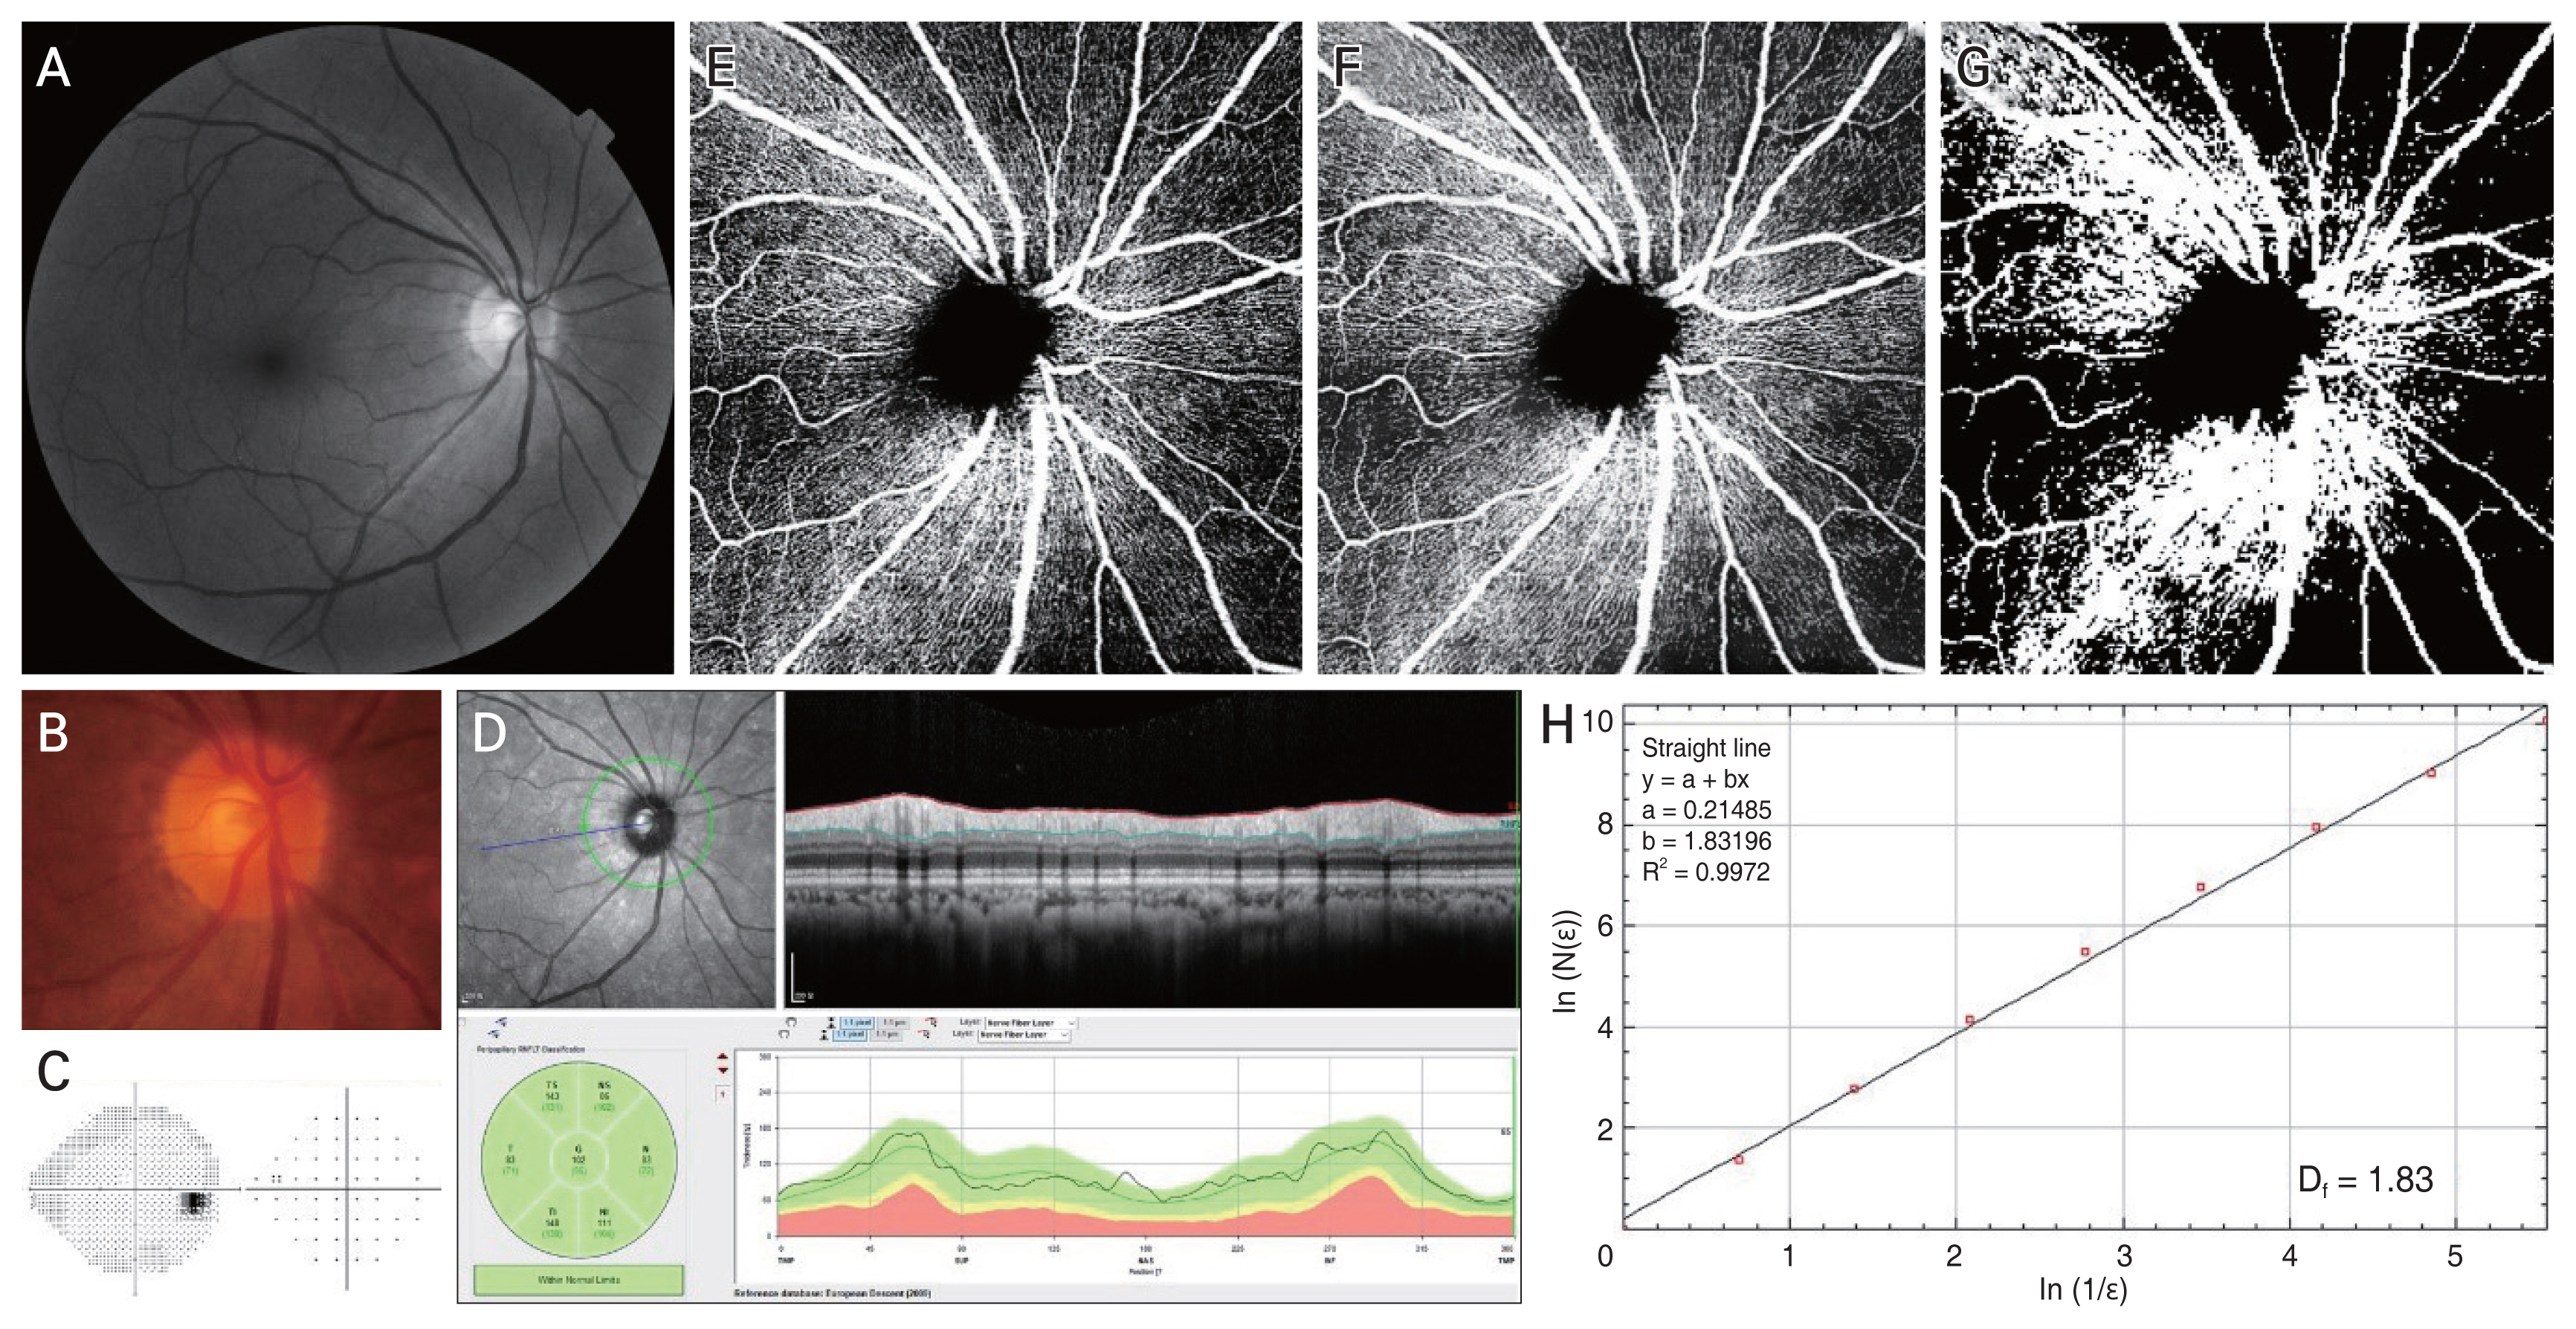
Fractal dimension calculation. (A) Red-free fundus photography, (B) disc photography, (C) visual field, and (D) optical coherence tomography (OCT) results showing no glaucomatous damage. (D) Average peripapillary retinal nerve fiber layer thickness was 102 μm by OCT. (E) Peripapillary OCT angiography image obtained by predefined en face slab of superficial vascular complex (SVC). (F) After applying the nonlocal means denoising filter to reduce background noise, (G,H) the fractal dimension (Df) was calculated from the converted gray-scale image using the box-counting method provided by the ImageJ software program. (H) The slope of a log–log plot is the fractal dimension of the peripapillary SVC vasculature. In the box-counting method, a grid is drawn and then the number of boxes (N) of the grid that are covering parts of the image is counted. As the grid becomes finer, magnification factor ɛ increases, and N increases reciprocally. In the pattern with self-similarity-like vessels, the slope of their changes converges: the fractal dimension (Df = log N / log ɛ), which is calculated as the slope of a log–log plot.
Vessel density calculation
Vessel density was calculated from the same images using ImageJ software. After the images were binarized through Otsu’s method, the percentage of vessel-occupied area was calculated [25,26].
Data analysis
The group comparisons were performed by way of the independent t-test for the continuous variables and by chisquare testing for the categorical variables. The diagnostic utilities of parameters were determined by calculating the areas under the receiver operating characteristic (ROC) curves (AUCs). The ROC curve shows the trade-off between sensitivity and specificity. An AUC of 1.0 represents perfect discrimination, whereas an AUC of 0.5 represents chance discrimination. The following established five-category rating scale was used for interpretation of AUC values: >0.90, excellent; 0.80–0.90, good; 0.70–0.80, fair; 0.60–0.70, poor; and 0.50–0.60, fail [27]. Univariable and multivariable analyses were run to determine the factors associated with fractal dimension, and parameters with a p-value less than 0.10 in the univariable analysis were included from the subsequent multivariable analysis. Statistical analyses were performed with commercially available software (Stata ver. 16.0; Stata Corp., College Station, TX, USA). The data herein are presented as mean ± standard deviations except where stated otherwise, and the cutoff for statistical significance was set to p < 0.05.
Results
A total of 113 eyes from 113 participants were recruited between January 2019 and December 2020. Of these, 16 subjects were excluded due to either poor OCTA image quality or fractal dimension calculation failure, which resulted in a final sample of 97 eyes from 97 subjects (64 POAG eyes and 33 control eyes). Their demographic and clinical characteristics are summarized in Table 1.

Demographic data according to diagnosis
The fractal dimension of SVC correlated with the average RNFL thickness (r = 0.723, p < 0.001) (Fig. 2A), whereas it did not correlate with that of AVC (r = −0.010, p = 0.922) (Fig. 2B). In POAG eyes, the fractal dimension of SVC decreased as the average RNFL thickness decreased according to disease severity (Fig. 3A–3I). The glaucoma-diagnostic utility was excellent for the average RNFL thickness (AUC, 0.889; 95% confidence interval [CI], 0.825–0.953), and good for the fractal dimension of the SVC (AUC, 0.772; 95% CI, 0.675–0.870). The AUC difference was statistically significant (p = 0.008) (Fig. 2C).
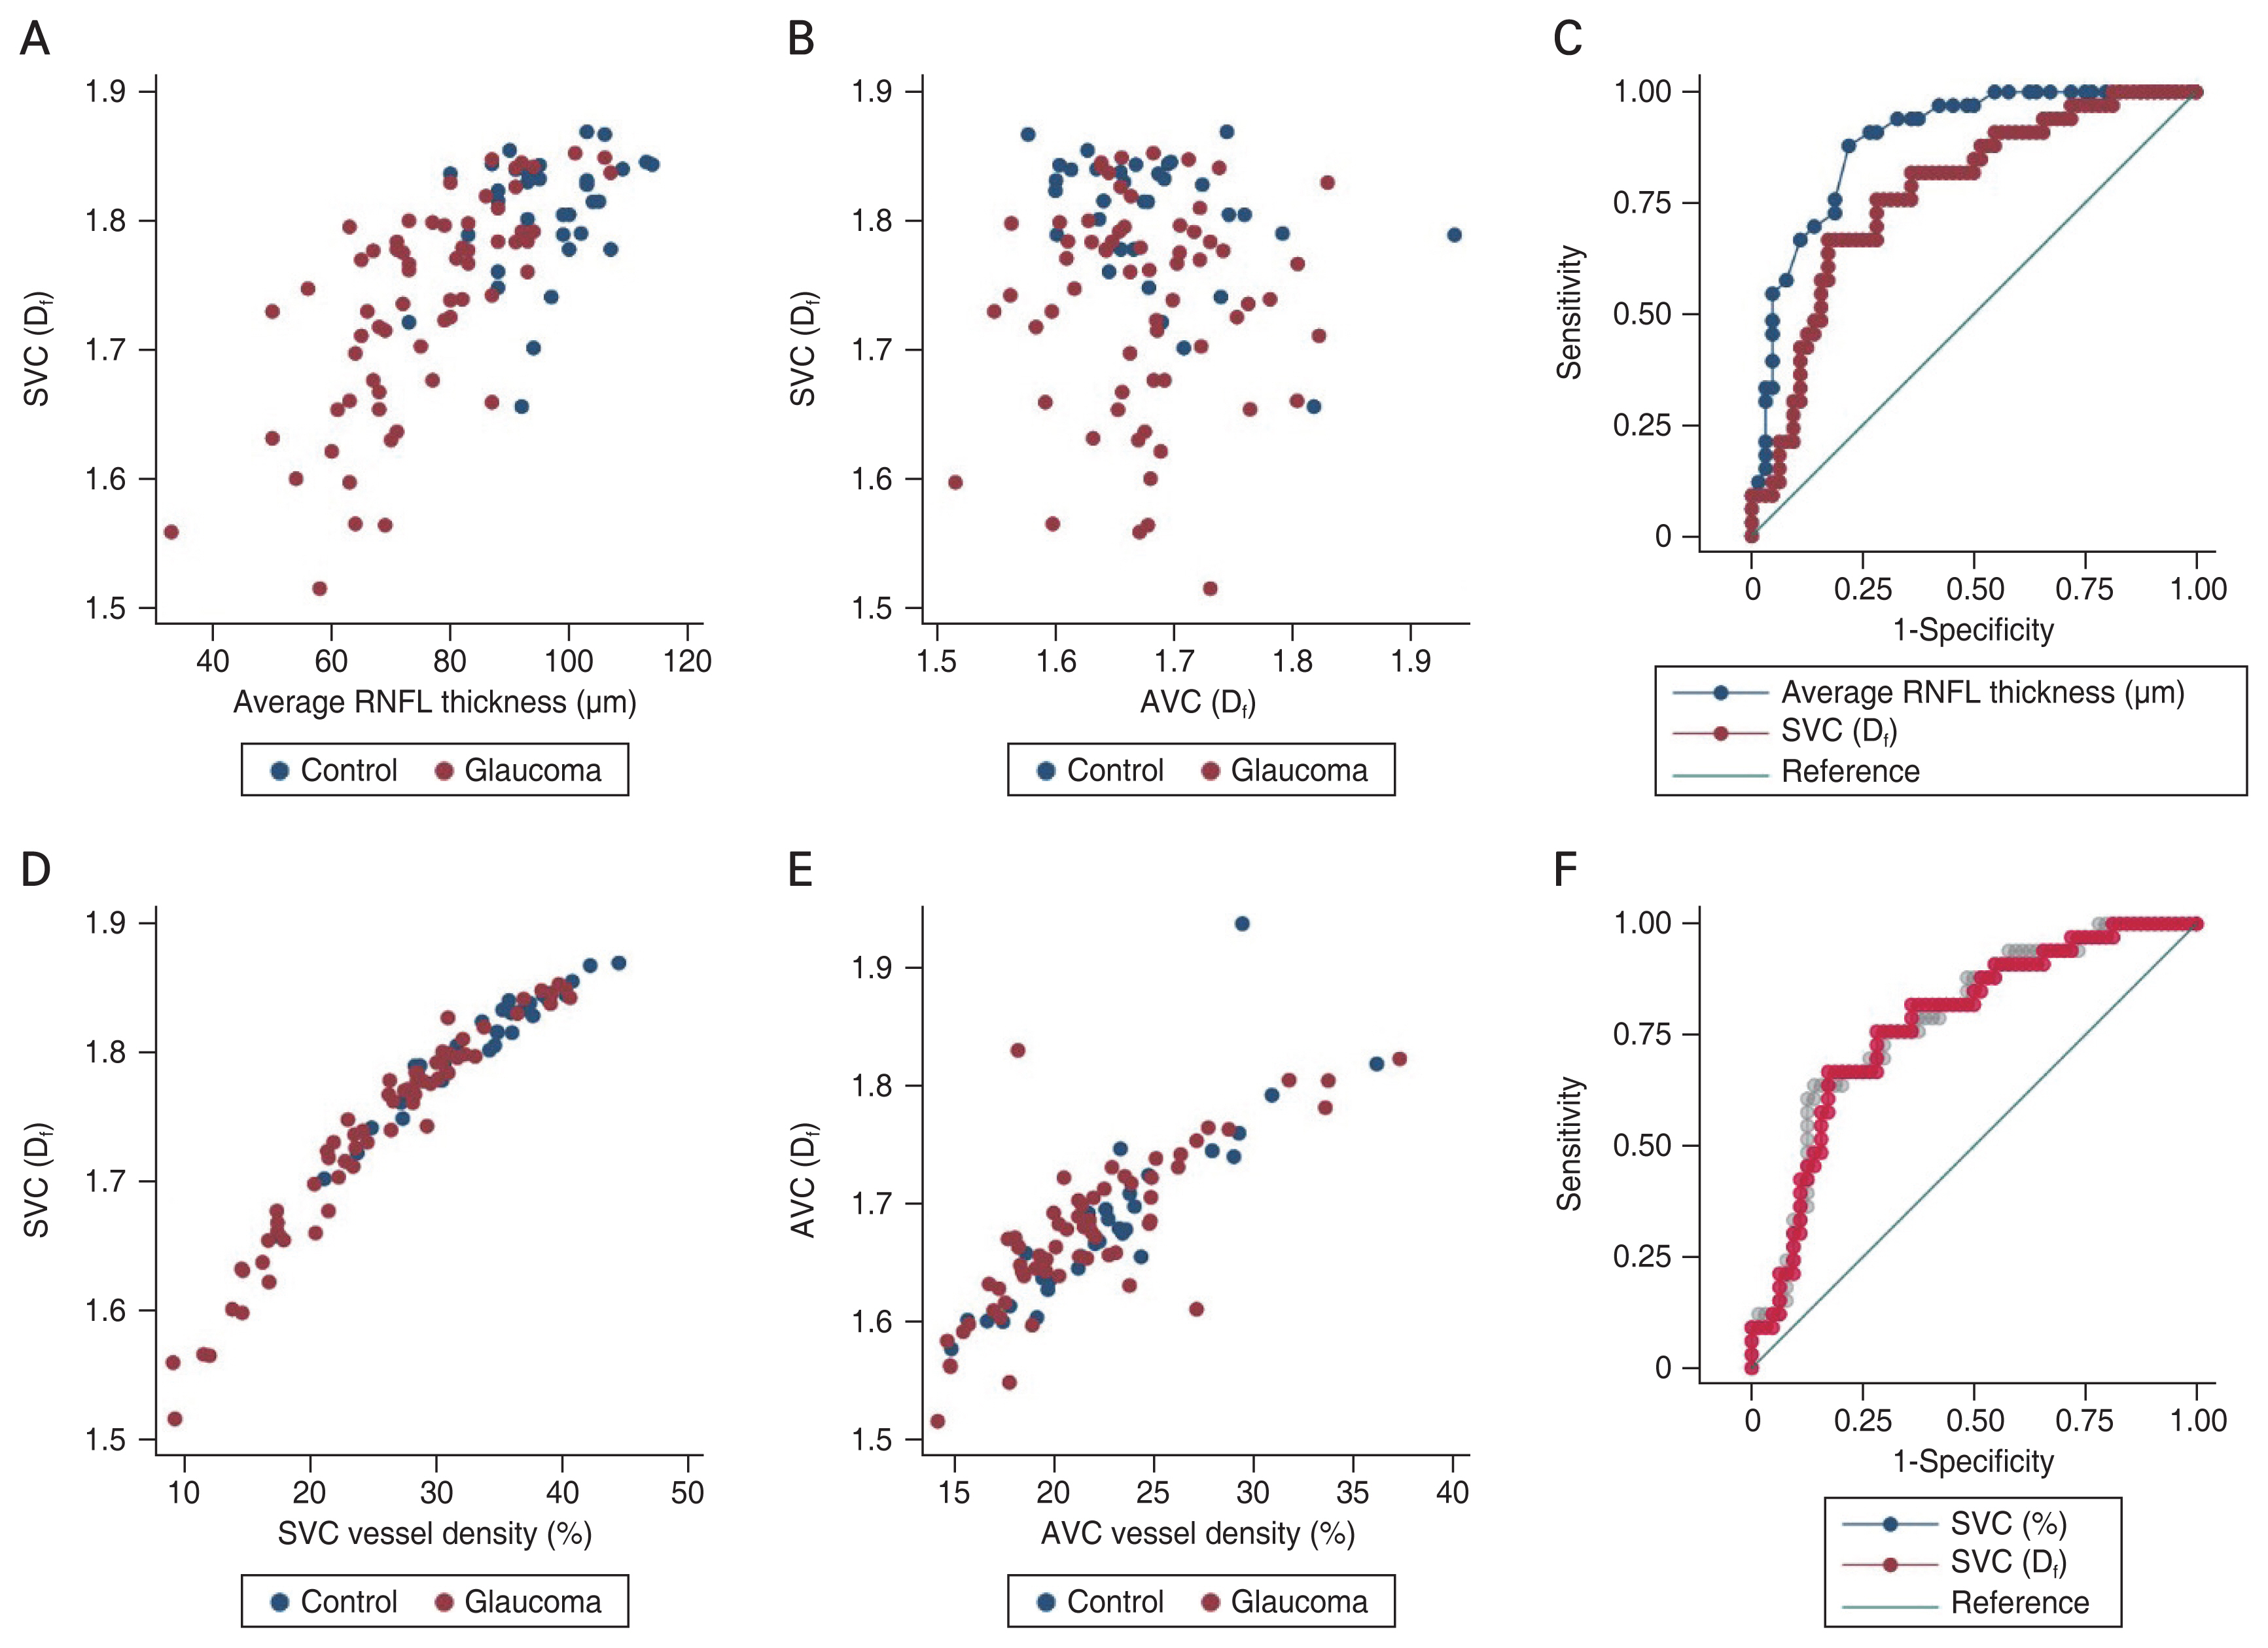
Scatter plots and receiver operating characteristic (ROC) curves comparing the fractal dimension (Df) of vascular complex, vessel density, and average retinal nerve fiber layer (RNFL) thickness. (A) The fractal dimension of superficial vascular complex (SVC) and average RNFL thickness show clear correlation (r = 0.723, p < 0.001). (B) The fractal dimension of SVC and that of avascular complex (AVC) do not show any correlation (r = −0.010, p = 0.922). (C) Area under the ROC curve (AUC) is larger in average RNFL thickness than in the fractal dimension of SVC (p = 0.008). (D) The fractal dimension of SVC showed a clear correlation with vessel density of SVC (r = 0.969, p < 0.001). (E) The fractal dimension of AVC showed a clear correlation with vessel density of AVC (r = 0.778, p < 0.001). (F) The AUC comparison showed no difference between fractal dimension and vessel density of SVC (p = 0.557).
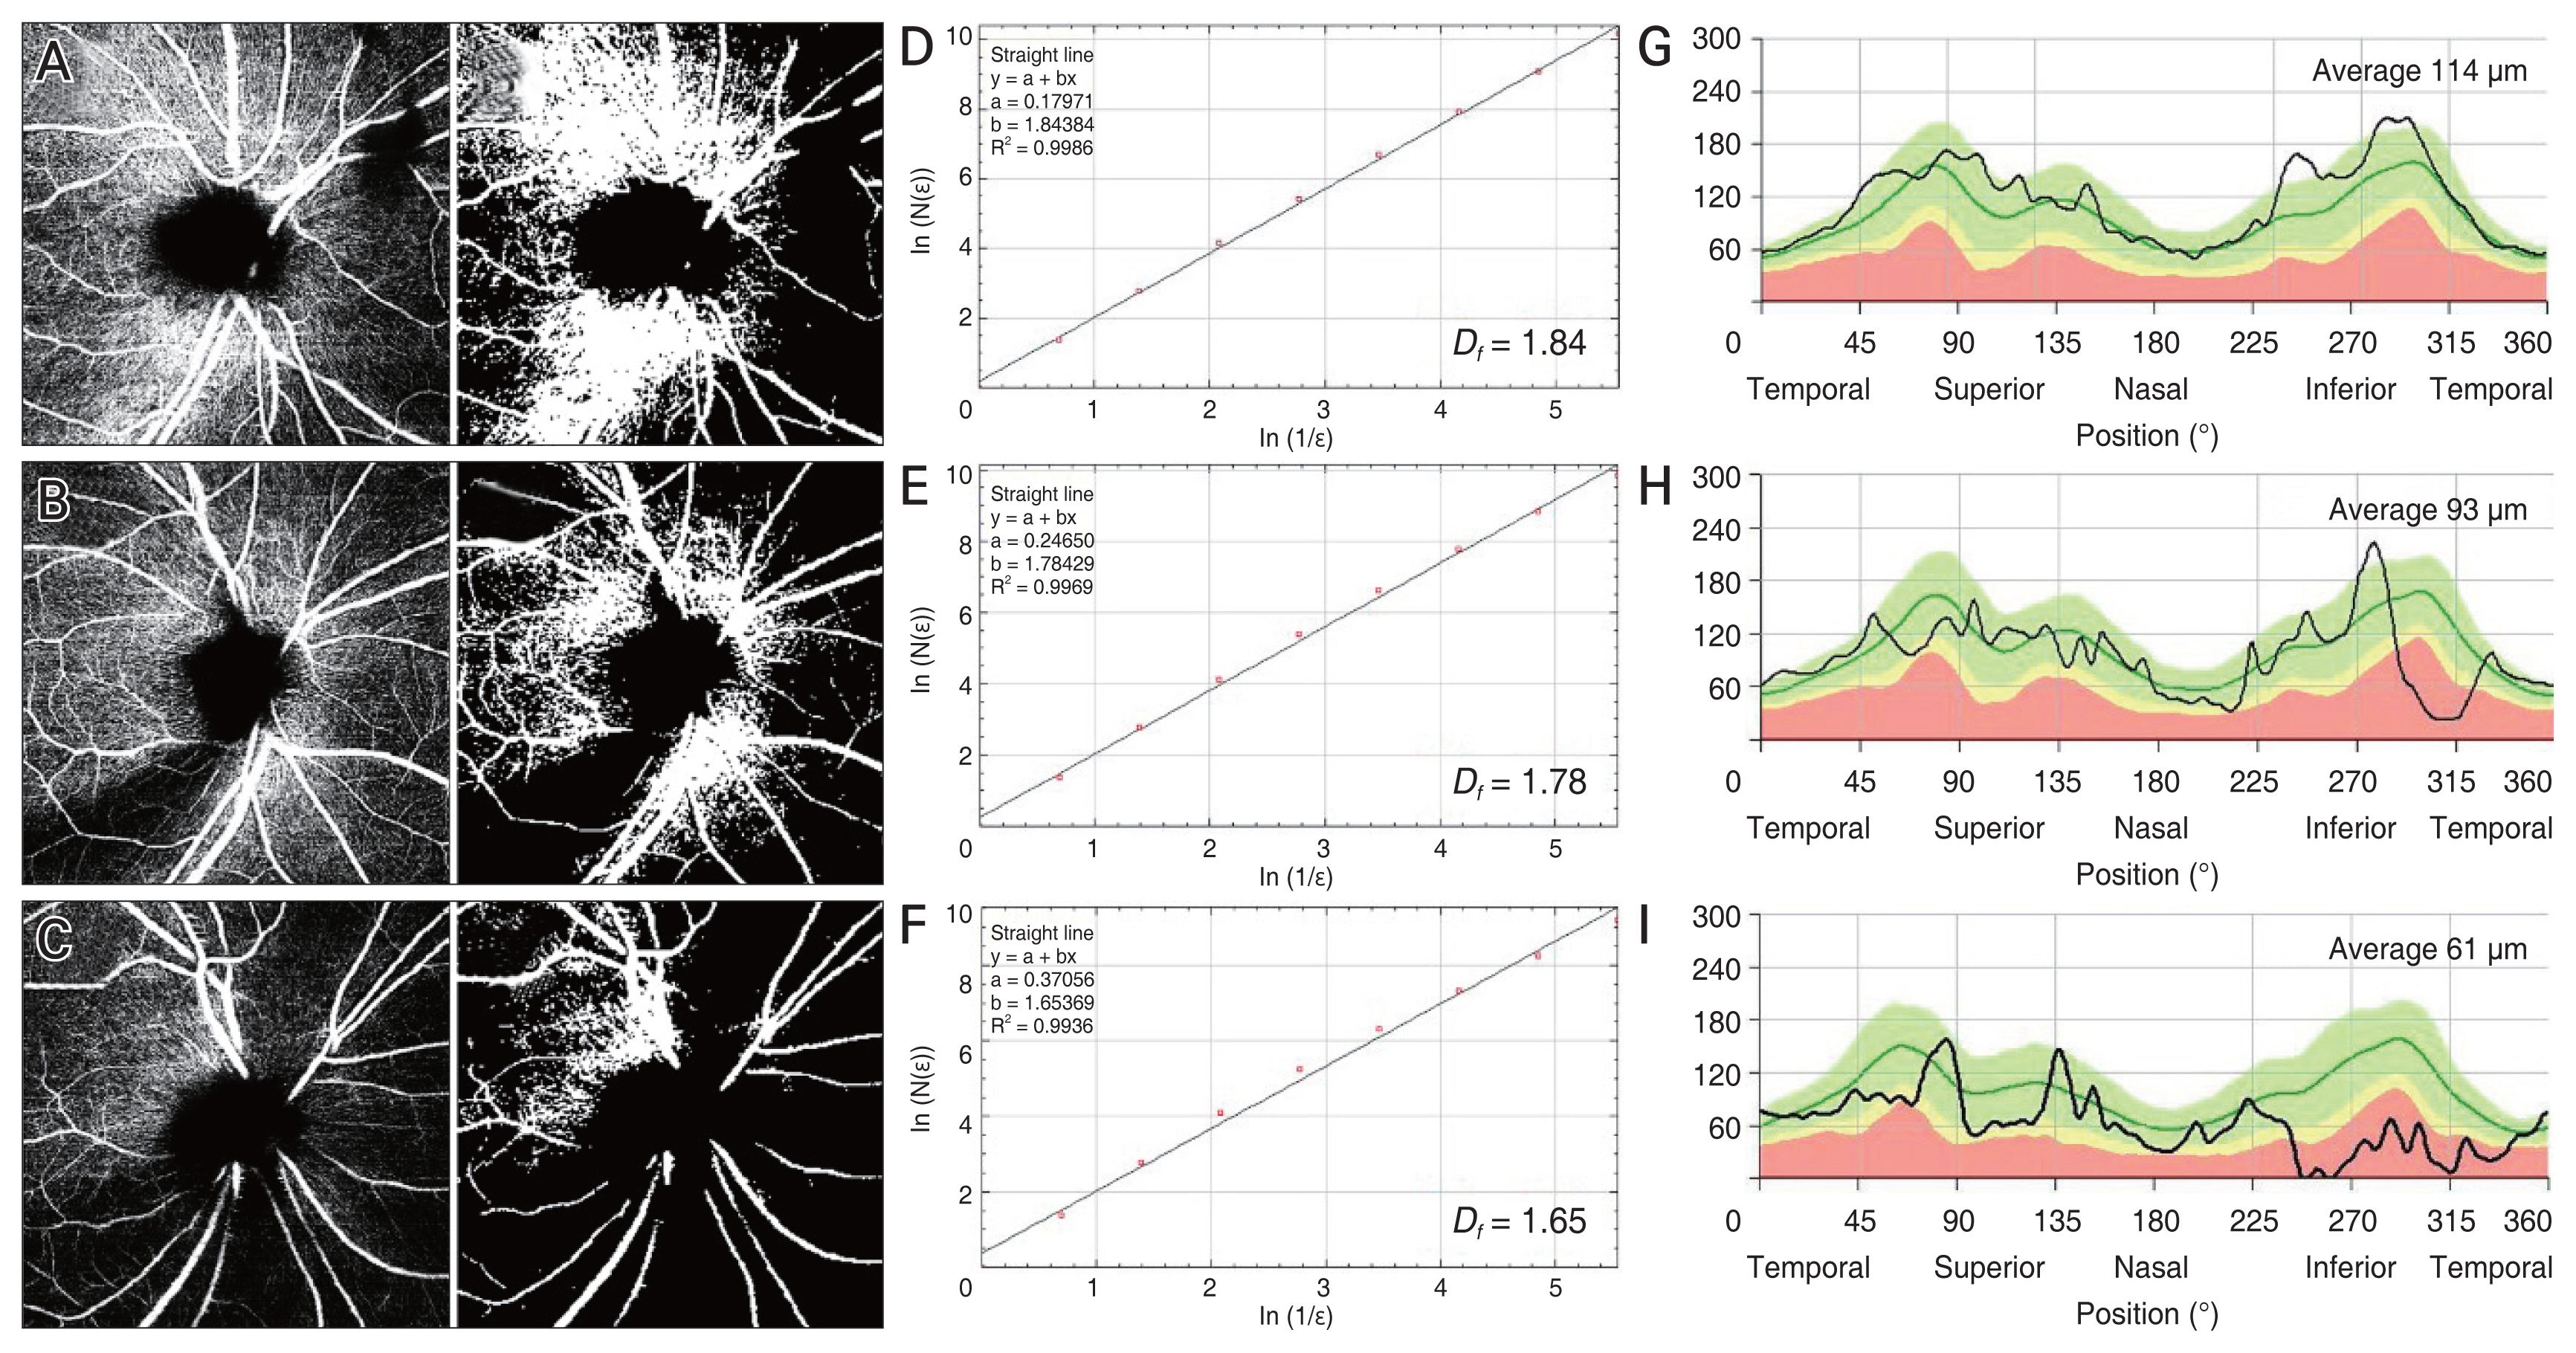
Representative cases. (A–C) Raw and converted optical coherence tomography angiography images obtained by predefined slab of superficial vascular complex. (D–F) Fractal dimensions (Df). (G–I) Peripapillary retinal nerve fiber layer (RNFL) thickness maps. Each row contains information on the same subject. As the glaucoma severity increases, the fractal dimension declines, so does the average RNFL thickness.
The fractal dimension showed a good correlation with the vessel density in both SVC (r = 0.969, p < 0.001) (Fig. 2D) and AVC (r = 0.817, p < 0.001) (Fig. 2E). The glaucoma-diagnostic utility of SVC vessel density (AUC, 0.778; 95% CI, 0.683–0.874) was not statistically different from that of the SVC fractal dimension (p = 0.557) (Fig. 2F).
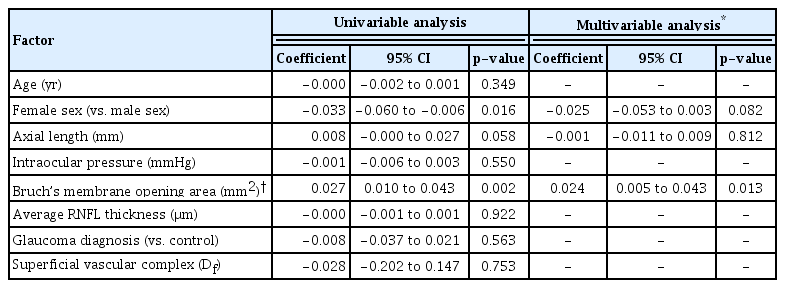
Multivariable regression analyses were performed to reveal the associative factors for each fractal dimension. The fractal dimension of the SVC was higher in subjects of younger age ( p < 0.001) and with shorter axial length (p < 0.001) and thicker average RNFL thickness (p < 0.001) (Table 2). The fractal dimension of the AVC, meanwhile, was higher in subjects with larger BMO area (p = 0.013, Table 3).
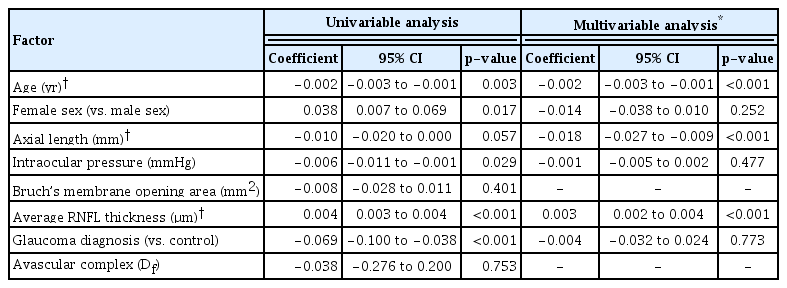
Factors associated with fractal dimension of superficial vascular complex
Factors associated with fractal dimension of avascular complex
Discussion
In this study, we compared the vascular complexities between POAG and control subjects using fractal dimension analysis. The fractal dimension was smaller in the superficial layer, while it showed no difference in the deeper layer of POAG patients when assessed with OCTA images. Moreover, the fractal dimension of the superficial layers showed a significant correlation with the average RNFL thicknesses. This implied that the fractal dimension of the superficial retinal vasculature can be used as a marker reflecting glaucoma severity quantitatively.
The fractal dimension is a ratio providing a statistical index of complexity, which describes the space-filling capacity of a pattern by the noninteger dimension: a lacunar structure has a dimension value of between 1 (line) and 2 (plane). To define the fractal dimension, we used the box-counting method. In this method, a grid is drawn to the given pattern and then the number of boxes of the grid that are covering parts of the image is counted. As the grid becomes finer, magnification factor ɛ increases, and the number of boxes (N) increases reciprocally. In the pattern with self-similarity-like vessels, the slope of their changes converges to the fractal dimension. As arborizing structures, the vessels are very suitable for evaluation of the fractal dimension. In contrast to density, the fractal dimension is unaffected by the size of the surface plane, and thus it has the potential for more robust parameters of vascularity. The fractal dimension has been used for evaluation of macular vascularity in diabetic retinopathy [12], hypertensive retinopathy [17], and age-related macular degeneration [16]. In POAG, the fractal dimension has been used for evaluation of ONH vascularity as measured by Heidelberg Doppler flowmetry [18]. To the best of our knowledge, however, fractal dimension analysis was not used to evaluate the layer-by-layer vascularity of the ONH and peripapillary area, which has been possible only since the recent advent of OCTA.
Among the fractal dimensions of the ONH layers, that of the SVC showed a close correlation with the average RNFL thickness. Since the vessels in the superficial layer supply the RNFL layer, RNFL thickness might be closely associated with superficial vascularity as assessed by the fractal dimension. In healthy subjects, the peripapillary retinal vasculature showed a significant correlation with peripapillary retinal thickness when assessed with OCTA [28]. Lee et al. [29] demonstrated the topographic relationship between decreased superficial parapapillary vascularity and localized RNFL defects. In the present study, we derived a new quantitative means of describing vascularity. Furthermore, RNFL thickness shows large variations among individuals and OCT machines, whereas the fractal dimension is a standardized parameter between 1 and 2. Therefore, the fractal dimension of superficial retinal vascularity may have potential as a new ONH parameter for assessment of glaucoma.
The fractal dimension of the AVC, however, did not show any correlation with RNFL thickness in our study. Since the deep vessels in the ONH rarely supply the retinal layers, they would not be affected by RNFL thickness. In our study, the fractal dimension of AVC was associated with BMO area. A larger BMO would enable better visualization of underlying vessels, resulting in a higher fractal dimension.
In this study, we introduced a new parameter, fractal dimension of vascular complex, for ONH-evaluation purposes. Although the fractal dimension of the SVC was not superior to the average RNFL thickness in glaucoma diagnosis, the concept of assessing vascularity would be very helpful, since this analysis provides us with a quantitative value for further analysis. Although the fractal dimension of the vasculature showed a clear correlation with the vessel density and their glaucoma-diagnostic abilities were similar, we considered that the fractal dimension has a theoretical strength for the purposes of a future study, since it is less affected by the limitation imposed by the resolution (Supplementary Fig. 1D–1F). The average RNFL thickness did not match exactly with the fractal dimension of the SVC, the discrepancy between them might be useful for ONH categorization according to etiology. Moreover, the fractal dimensions of other layers might be useful in future evaluations of vascular pathology in the deep ONH structure.
This study has several limitations. First, all of the participants were South Korean, and there may be ethnic differences in ONH morphology [30]. Second, about 14% of the enrolled subjects were excluded due to poor image quality or fractal dimension calculation failure. Calculation algorithms should be improved for more general use. Third, it is known that different OCTA machines provide different vascular indices [21]; therefore, our results may not be directly translatable into other OCTA machines. We speculate, however, that the concept of fractal dimension analysis could be incorporated into any OCTA machines other than Spectralis OCT. Fourth, the control group was enrolled from glaucoma-suspect patients, and diagnostic utility depends on a study population: there will be higher diagnostic utility in the severe-glaucoma patients/healthy control subjects setting, while there will be lower diagnostic utility in the early-glaucoma patients/glaucoma-suspect patients setting. Therefore, the diagnostic utility observed in this study should be interpreted cautiously in the contexts of other populations. Fifth and finally, the fractal dimension of vascular complex does not measure the vascular flow the same as it does the vascular density. If ONH perfusion status could be reliably imaged in the future though, the fractal dimension of perfusion status would provide meaningful serial quantitative parameters for assessment of glaucoma patients.
In conclusion, the layered ONH vascularity could be analyzed quantitatively by adopting fractal dimension analysis of OCTA images. The fractal dimension of the SVC correlated with the average RNFL thickness, and it was reduced in POAG patients. The fractal dimension of vascular complex could be a novel standardized marker for assessment of vascularity in glaucoma of various etiologies.
Acknowledgements
None.
Notes
Conflicts of Interest: None.
Funding: This research was supported by a grant of the Korea Health Technology R&D Project through the Korea Health Industry Development Institute (KHIDI), funded by the Korean government (the Ministry of Health and Welfare) (No. HI22C1234). The funders had no role in the study design, data collection and analysis, decision to publish, or preparation of the manuscript.
Supplementary Materials
Supplementary materials are available at https://doi.org/10.334/kjo.2022.0089.
Supplementary Fig. 1.
Fractal dimension analysis.