


Diabetic macular edema (DME) is known as the most common cause of vision loss in diabetic patients [1]. The pathogenesis of DME is mainly resulted from the disruption of the blood-retinal barrier causing accumulation of fluid in the intercellular space of the retina [2]. Previous studies have shown that diabetes mellitus (DM) and its microvascular complications are associated with chronic inflammation as well as the dynamic of immune system [3-7]. These findings suggested an interaction between inflammation and the pathogenesis of diabetic retinopathy (DR). Also, similar interactions have been recently postulated between the elevated serum uric acid and microvascular diseases like DR.
Vascular endothelial growth factor (VEGF) inhibitors prevent visual loss and improve vision ability in DME patients [8]. Before the use of anti-VEGF agents for the treatment of DME, systemic anti-VEGF drugs such as bevacizumab, had been administered for the treatment of some malignancies [9]. It has been reported that the systemic inflammatory status of the patients at the baseline affected the outcomes of systemic administration of bevacizumab for the treatment of certain types of cancer [10]. Accordingly, the status of the immune system may have some correlations with the outcomes of intravitreal bevacizumab (IVB) for the treatment of DME. The status of immune system can be indirectly evaluated by measuring peripheral venous white blood cell count as well as some inflammatory indices including lymphocyte to monocyte ratio (LMR), lymphocyte to neutrophil ratio (LNR), lymphocyte to platelet ratio (LPR), and platelet count [11]. In addition to the inflammatory factors, serum uric acid is also involved in vascular damages [12]. As endothelial damage is a core event in DR, abnormal uric acid levels may influence the endothelial homeostasis in diabetic patients. In the present study, we investigated the relationship between serum uric acid and inflammatory indices, including platelet count, LMR, LNR, LPR, and the outcomes of IVB for the treatment of DME.
Materials and Methods
Ethics statement
This study was approved by Ethics Committee of the Ophthalmic Research Center, Shahid Beheshti University of Medical Sciences, Tehran, Iran. All procedures performed in studies involving human participants were in accordance with the ethical standards of the institutional research committee and with the 1964 Declaration of Helsinki and its later amendments or comparable ethical standards.
This was a prospective observational study conducted on patients with center involved DME between April 2017 and March 2019. This study was approved by our ethics committee and editorial board. A detailed written informed consent was taken from all the patients in terms of the tenets of the Declaration of Helsinki.
PatientsŌĆÖ selection and study design
The patients with center involved DME (central macular thickness of more than 250 ╬╝m) and the best-corrected visual acuity (BCVA) Ōēż20/30 according to the Snellen chart examination, were consecutively included in the period of the study. For those patients with bilateral DME, one eye was randomly selected to be enrolled in this study. The eyes with refractory DME or BCVA Ōēż20/320, or those with concomitant vision-threatening retinal disease (such as epiretinal membranes or vitreo-retinal interface disease) were excluded. Moreover, eyes with active proliferative DR, history of laser therapy in the past 3 months, history of intravitreal anti-VEGF or steroid injection in the past 3 months, pathologic myopic fundus, and any intraocular surgery in the past 3 months were excluded. The other exclusion criteria were as follows: uveitis, pregnancy, any hematological disease or malignancy, active systemic or local infection in the past 3 months, renal failure with serum creatinine more than 3 mg/dL, and any myocardial infarction and cerebrovascular accident in the past 3 months. Respective to uric acid metabolism, patients with gouty arthritis, renal stones, or extremely high uric acid levels (>12 mg/dL) were also excluded, since they had to be treated with uric acidŌĆÖs lowering agents.
All the patients received three monthly intravitreal injections of 0.125 mg bevacizumab (Avastin; Genentech, South San Francisco, CA, USA) under aseptic conditions. Thereafter, they were examined on the following day for probable complications, and then monthly for at least 3 months.
Clinical examination and data collection
The eligible patients underwent complete ophthalmic examination. The baseline color fundus photographs and angiograms were read by a single retina surgeon, and the stage of DR was presented in terms of the International Clinical Diabetic Retinopathy Disease Severity Scale [13]. Measurement of central macular thickness (CMT) was performed using optical coherence tomography (Heidelberg Engineering GmbH, Heidelberg, Germany) once at the baseline and once 1 month after the third injection. All measurements of BCVA were performed by a single trained optometrist who was masked to the studyŌĆÖs cases. Logarithm of the minimum angle of resolution of BCVA was calculated to be involved in the analyses. Subsequently, venous blood samples were taken before the injection of the first IVB. All biochemical analyses, including peripheral white blood cell count, separated blood cell count of neutrophils, monocytes, lymphocytes and platelets, serum creatinine, uric acid, and glycated hemoglobin (HbA1c) level were also performed in a single laboratory. Notably, the LMR, LPR, and LNR were calculated as the ratios of the lymphocytes to monocytes, platelets, and neutrophils, respectively.
Statistical analysis and outcome measure
The primary outcome measure was the change of CMT, and the secondary outcome measure was the change of BCVA from baseline up to 1 month after the last injection. Some clinical parameters presumed as risk factors for CMT and BCVA changes were also examined, including baseline BCVA, baseline CMT, baseline HbA1c, duration of DM, lymphocytes, monocytes, neutrophils, LMR, LNR, LPR, and serum uric acid.
To present the obtained data, we used mean, standard deviation, range, frequency, and percent. Nonparametric analyses were used to compare the data. To quantify the mean of changes in BCVA and CMT with each unit change in peripheral blood parameters, Pearson or Spearman correlation analysis was used. To evaluate the factors that are significantly associated with BCVA and CMT changes, univariate and multivariate linear regression models were used. Patients who missed follow-up at any stage of the study were not included in the analyses. All these statistical analyses were performed by IBM SPSS ver. 22.0 (IBM Corp., Armonk, NY, USA). A p-value less than 0.05 was considered as statistically significant.
Results
A total of 212 potentially eligible patients with center involved DME were screened during the period of the study. After excluding the patients with exclusion criteria of the study, 109 cases were enrolled. During the follow-up period, 19 cases were missed. Also, 10 patients were excluded due to a need for different therapeutic regimens or acquiring exclusion criteria of our study during the follow-up period. Accordingly, a total of 80 eyes from 80 patients (46.2% men and 53.8% women) diagnosed at the center involved with DME, were included in this study.
The mean age of the participants was 59.03 ┬▒ 7.43 years old. The severity of DR was ŌĆ£mild nonproliferative DRŌĆØ in 22.5%, ŌĆ£moderate nonproliferative DRŌĆØ in 28.7%, and ŌĆ£severe nonproliferative DR or regressed proliferative DR ŌĆ£ in 48.7% of the subjects. The mean level of HbA1c was 7.51% ┬▒ 1.60%. The mean duration of DM was 7.41 ┬▒ 1.23 years. Baseline characteristics of the patients are shown in Table 1.
To evaluate the correlation of leukocyte ratios and serum uric acid with severity of DR, the values were compared between the main DR severity groups (Table 2). Notably, there was no significant difference in immune cell counts and ratios and serum uric acid levels between DR severity groups (p > 0.05).
Before the injections, the mean logarithm of the minimum angle of resolution of BCVA and CMT were 0.63 ┬▒ 0.43 and 451.25 ┬▒ 98.42 ╬╝m, respectively. The efficacy of three IVB on reducing CMT and improving BCVA was statistically significant (p < 0.001 for both outcomes).
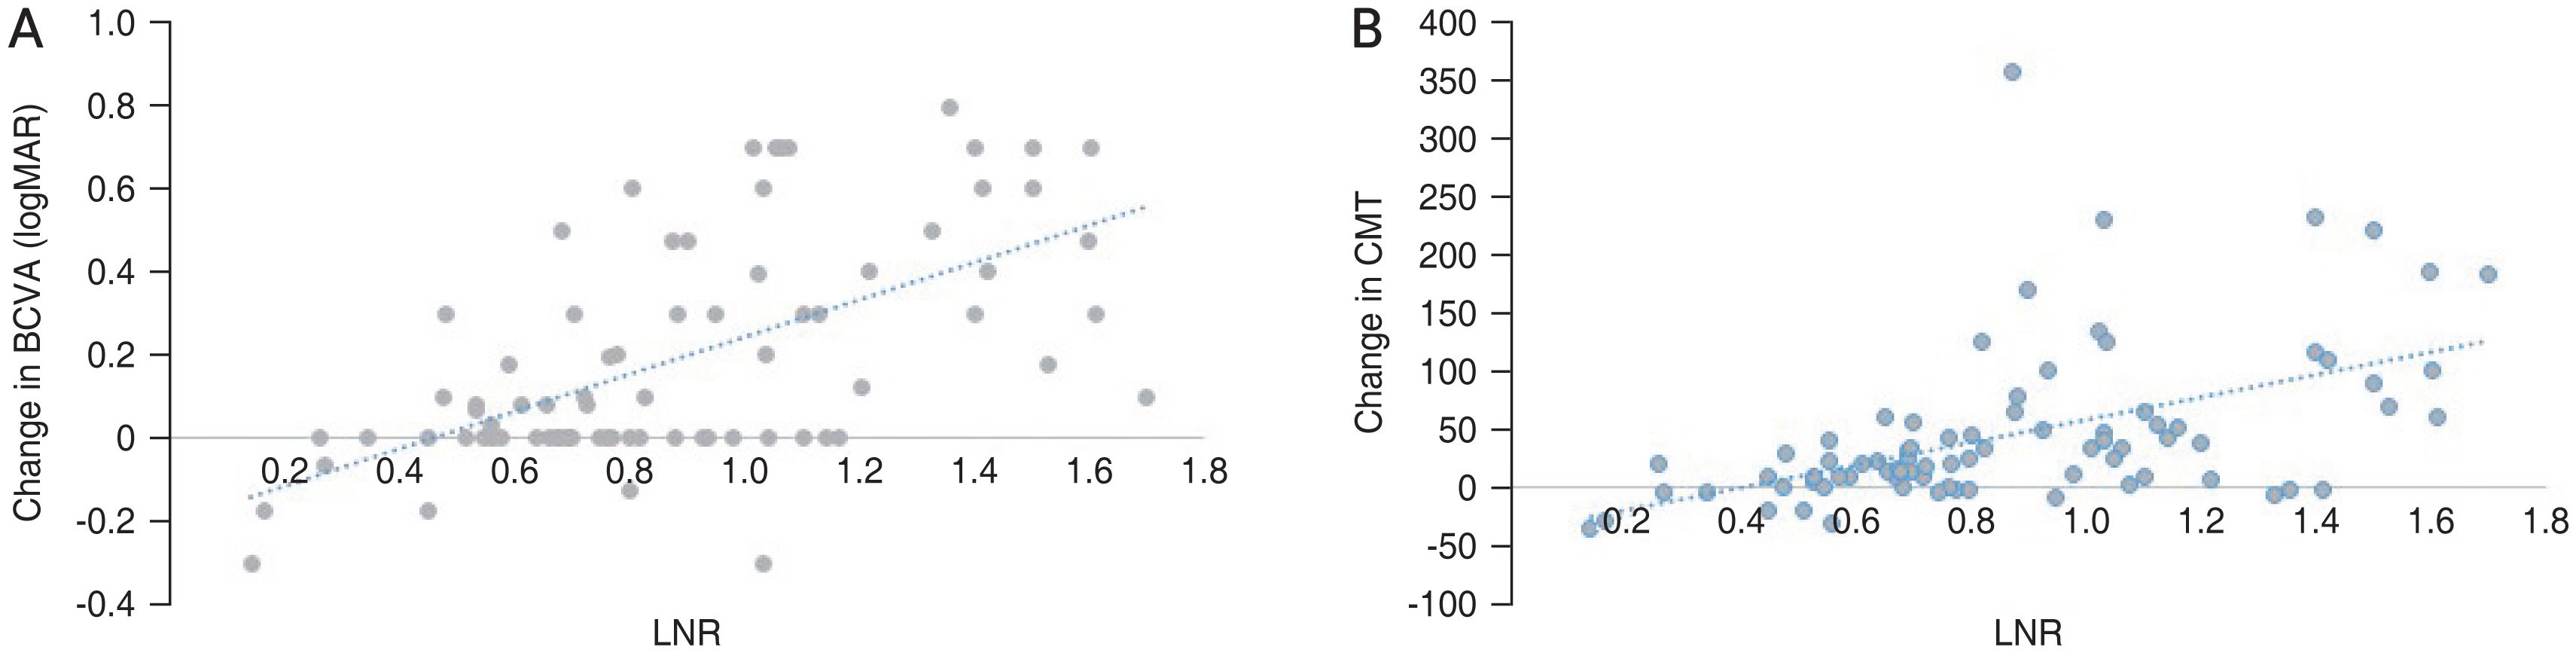
To evaluate the clinical factors determining the response to IVB at the end of month 3, correlations of BCVA or CMT changes with baseline characteristics were evaluated, which are summarized in Table 3. Higher durations of DM, monocytes count, and uric acid level were correlated with lower BCVA improvement at 3-month visits, while higher baseline BCVA, lymphocytes count, LNR, and LPR were correlated with larger improvement in BCVA at 3-month visits. Similarly, higher LNR, LPR, and lymphocytes count were correlated with larger improvement in CMT during 3 months, while uric acid level and neutrophils were negatively correlated with the changes of CMT (Fig. 1A, 1B, 2A, 2B).
By performing univariate linear regression analysis, baseline BCVA, duration of DM, lymphocyte count, monocyte count, neutrophil count, LNR, LPR, and uric acid level were correlated with the changes in BCVA. Multivariate analysis has also revealed that baseline BCVA (r = 0.125, p = 0.009), duration of DM (r = ŌłÆ0.216, p = 0.047), LNR (r = 0.712, p < 0.001), LPR (r = 0.238, p < 0.001), and uric acid (r = ŌłÆ0.397, p < 0.001) could be considered as the significant predictors of changes in BCVA in our subset of patients. LNR and uric acid also were the significant predictors of CMT changes in the patients with DME treated with IVB (r = 0.462 and r = ŌłÆ0.528,, respectively; p < 0.001) (Table 4).
Discussion
In the current study, we evaluated the predictive value of serum uric acid levels and leukocyte counts and ratios in the therapeutic response of the DME patients to IVB therapy. We observed that higher LNR and lower uric acid levels are correlated with larger improvement in BCVA and CMT at 3-month visit. Additionally, higher LPR is correlated with larger improvement in BCVA following IVB therapy in our patients.
It is believed that white blood cells counting, inflammatory cytokines, and inflammatory biomarkers can affect the occurrence and severity of DR [14-19]. Powell et al. [17] reported that salicylates may prevent the occurrence of DR; suggesting that inflammation can play a role in DR pathogenesis. Lutty et al. [16] in their study reported the association between white blood cells and DR occurrence. Additionally, tumor necrosis factor alpha, interleukins (interleukin-6 and interleukin-1╬▓), and intracellular adhesion molecule 1 have been postulated to be up-regulated in both serum and vitreous fluid in the patients with DR [14,18] A study by Woo et al. [19] showed that neutrophil count in circulation is closely associated with DR severity, indicating the considerable role of neutrophil mediated inflammation in both development and progression of DR. Moreover, it has been reported that the increased mean platelet volume is associated with the presence of DR and its severity [15]. Although previous studies have focused on innate immune function in diabetic patients, recent studies have showed the pivotal role of adaptive immune system in the pathogenesis of type 2 DM [20].
In more recent studies, different ratios of immune cell counts, including LPR, LMR, and LNR have been considered as biomarkers reflecting the dynamic of immune system. Correspondingly, these studies have reported positive correlations of conventional inflammatory markers with the LPR and LNR [11]. Subsequently, a large number of studies revealed the predictive value of these ratios, particularly in DM, DR, and various types of cancer [21-23]. Several studies have suggested that LNR may be lowered in patients with DR, which can also be linked with the severity of DR [11,24,25]. However, in a study by Ciray et al. [26], LNR was found to have no association with the pathogenesis of DR. In a meta-analysis, it was observed that LNR might be related to the presence of DR, but not linked with the DR grade; indicating that LNR might only play a role at the early stage of DR [15]. Yue et al. [11] in their study conducted the first investigation on the relationship among DR severity and the LPR and LMR. Their results indicated that the ratios were significantly lower in patients with DR, compared to those without DR. Additionally, it was concluded that the LPR, LNR, and LMR are superior to other cell parameters, e.g., neutrophil, lymphocyte, and total leukocyte counts.
The use of anti-VEGF agents for the treatment of DME has turned into a universal approach [1]. Also, these agents can also be used for the treatment of some malignancies; however, it has been shown that systemic immune condition, especially adaptive immune system, may affect the response of the patients to anti-VEGF therapy. Univariate analysis in the study by Botta et al. [10] revealed that a high number of circulating neutrophils and monocytes as well as a high NLR were associated with shorter progression-free survival as well as overall survival in bevacizumab-treated patients with lung cancer. In a review article, Ferrara [27] reported that resistance to anti-VEGF drugs may occur in patients with cancer, which can consequently lead to diseaseŌĆÖs recurrence. Furthermore, in that review, it was postulated that myeloid cells play a role in refractoriness to anti-VEGFs. In another study, it was shown that progression-free survival has improved in the patients who received chemotherapy on the day of the elevation of LMR [28]. In this study, a combination of cytotoxic chemotherapy agents and inhibitors of angiogenesis (Avastin) was used for the treatment of the patients with the advanced melanoma.
According to the finding of recent studies on the role of immune cells dynamic in the response to systemic anti-VEGF therapy, we have conducted the present study to investigate the effect of different immune cell indices, including LMR, LNR, and LPR, on the response of DME patients to intravitreal injection of bevacizumab, as an anti-VEGF agent. It is noteworthy that the role of adaptive immune system in the pathogenesis of both DM and malignancies [20,27], may predict a similar response to anti-VEGF therapy by DR patients.
The first study performed on this topic was published in 2019, where it was observed that a high neutrophil to lymphocyte ratio can be known as a prognostic factor in the treatment of DME patients with intravitreal ranibizumab [29]. Our study is the first prospective study with the purpose of investigating the roles of peripheral lymphocyte, neutrophil, monocyte, and platelet count, and of some inflammatory indices, including the LMR and LNR, as the predictors of the clinical outcome of DME treated with IVB.
Our subset of DME patients had no other inflammatory systemic or prominent ocular disease affecting the counts or ratios of leukocytes. Since a recent study has revealed that higher inflammatory indices may lead to the degenerative myopic changes, we excluded those patients with high myopia or pathologic myopic fundus from our study [30].
We observed that higher counts of lymphocyte and lower counts of neutrophils were correlated with more prominent improvements in BCVA and CMT in DME eyes treated with IVB. Besides cellŌĆÖs counts, two ratios derived from the counts of peripheral immune cells were found to be correlated with the CMT change and BCVA improvement in DME patients treated with IVB. Higher levels of LNR and LPR were also detected to have correlations with a better response to IVB in our patients. These results are in line with those of the recent reports, where a considerable role has been postulated for neutrophil mediated inflammation in both development and progression of DR [19]. The prognostic effect of high LNR on the response to anti-VEGF therapy in our cases, is in accordance with the findings of two other studies [10,28], which reported higher LMR and lower neutrophil count as predictive for a better response to anti-VEGF agents in patients with malignancy. From the aspect of intraocular treatment, our finding can be interpreted similarly to the conclusion of a study by Hu et al. [29] who reported high NLR as a negative prognostic factor for anti-VEGF therapy in DME patients. As concluded in another study, we believe that leukocyte ratios show a good stability, in comparison to absolute immune cell counts, even when physiological, pathological, and physical factors of the white blood cell count vary [11].
How these factors may contribute to DME and its response to IVB has not been clarified. Compared to generalized systemic disease like rheumatoid arthritis, inflammation level in DM would not be so severe to directly damage the retinal vasculature. Moreover, in uveitis macular edema patients, good responses are frequently observed to anti-VEGF in acute conditions, but poor response in chronic retinal edema. One explanation might be chronic neurovascular damage secondary to low level inflammation of DM and subsequent retinal microvascular decompensation. It might have lead to the unresponsive to anti-VEGF in our subset of patiets.
Although it was not reported before, higher LPR was a positive predictive factor for IVB therapy in our study. Both higher lymphocyte and lower platelet counts contribute to higher LPR. Platelets are known to have some physiological characteristics such as adhesion and aggregation [31]. The increased activation and aggregation of platelets are important causes of vascular complications in diabetes [32]. In a recent meta-analysis, the authors conjectured that the consumption of platelets during coagulation attributes mainly to the decreased platelets in DR patients [31]. However, according to our findings, structural and functional outcomes of IVB therapy in DME patients were not in association with plateletsŌĆÖ counts. Similarly, difference in plateletsŌĆÖ count was not statistically significant among different DR severities. Accordingly, the value of higher LPR may be related to the higher lymphocyte counts manifested in this ratio.
The elevated serum uric acid has been shown to be associated with endothelial cellŌĆÖs dysfunction. Hyperuricemia inhibits nitric oxidase synthetase and activates renin-angiotensin pathway, where it can contribute to endothelial damage through hypertension. In addition, uric acid can directly damage endothelial and vascular smooth muscle cell [12,33]. It was believed that the elevated uric acid level is associated with micro- and macro-vascular disorders, including kidney and coronary diseases. Recently, it was postulated that an increased uric acid level can be significantly correlated with the DR in patients with type 2 DM [34]. In our study, the mean of serum uric acid was not different among the patients with different DR severities; however, we have observed that higher levels of uric acid were associated with poorer responses to IVB therapy in the DME patients. We believe that the elevated uric acid level in a patient with diabetes is a marker of poor metabolic condition, instead of a major causative agent for diabetic microangiopathy. Accordingly, in our study, patients with the elevated uric acid levels have experienced a poorer control of systemic risk factors, manifested by poorer response to IVB therapy. If further studies establish the role of uric acid in pathogenesis of microvascular complications of DM, then it may change the main indications of uric acid lowering drugs, by adding diabetic vasculopathies to the indications of starting uric acid lowering regimens.
When interpreting the results of the present study, several limitations should be taken into consideration. Firstly, the number of the included cases was insufficient for having a persuasive conclusion on the association of LMR, LNR, and LPR with the response to IVB therapy. Secondly, all the included cases were treated with 3 IVB injection, while more consecutive injections with long-term and delayed-onset effects may change the results. In this study, we have investigated the short-term effect of immune dynamic on IVB therapy, since the patients were followed-up for 3 months. Finally, this prospective study did not investigate the relationship of the LMR, LNR, and LPR to other factors that may affect the development of DR and its response to the required treatment. Regarding serum uric acid, it can be stated that it is a parameter that can be affected by a number of agents from cultural factors to nutritional habits and gastrointestinal disease. Therefore, measuring uric acid level once throughout a study course, with no continuous monitoring of its serum levels, may affect any subsequent conclusion. However, it is the first study conducted on the role of serum uric acid levels in the treatment of DM ocular complications, and our results may be considered as an introduction to the topic.
Overall, our results will increase knowledge on the pathogenesis of DR and its relationship with immune system condition. Our findings may approve previous results about the predicting value of leukocyte ratios in DR and DME treatments. Accordingly, patients who are candidates for IVB therapy can be consulted about the prognosis of the treatment.

 PDF Links
 PubReader
 ePub Link
 Full text via DOI
 Full text via PMC
 Download Citation
 Print
Print


