Factors Associated with Macular Staphyloma Area on Ultra-widefield Fundus Images
Article information
Abstract
Purpose
To assess the feasibility of applying ultra-widefield fundus (UWF) images for macular staphyloma area (MSA) measurement and investigate the associated factors with MSA.
Methods
This is a retrospective study. MSA was measured by UWF imaging. Central foveal thickness, subfoveal choroidal thickness, subfoveal scleral thickness were measured on spectral domain optical coherence tomography. Intraclass correlation coefficients of MSA measurement would be evaluated. Multiple linear regression analysis was used to analyze the associated factors with MSA.
Results
In total, 135 eyes of 92 patients were enrolled. The mean age was 64.73 ± 10.84 years. Mean MSA on UWF image was 279.67 ± 71.70 mm2. Intraclass correlation coefficients of MSA measurement was 0.965 (95% confidence interval [CI], 0.946 to 0.977; p < 0.001). In the multiple linear regression analysis, after adjusting for subfoveal choroidal thickness, best-corrected visual acuity, central foveal thickness, and subfoveal scleral thickness, the factors independently related to MSA were axial length (β = 8.352; 95% CI, 3.306 to 13.398; p = 0.001), sex (β = −26.673; 95% CI, −51.759 to −1.586; p = 0.037), age (β = 1.184; 95% CI, 0.020 to 2.348; p = 0.046).
Conclusions
It is feasible to measure MSA on UWF image. Female, longer axial length, and older age may indicate larger MSA.
The proportion of patients with high myopia is about 1% to 2% in the United States, 5% to 8% in Japan, and as high as 15% in Singapore [1]. The prevalence of posterior staphyloma is positively correlated with the axial length (AL) of the eye. According to Curtin [2], the prevalence of staphyloma has risen from 1.4% for ALs of 26.5–27.4 mm to 71.4% for ALs of 33.5–36.6 mm. In addition, 77.5% of the staphyloma eyes have significant chorioretinal atrophy [2].
The shape of posterior staphyloma is variable and can be detected by fundus photography, ultrasonography, multicolor fundus photography, three-dimensional magnetic resonance imaging (3D MRI) [3], and wide-field optical coherence tomography (OCT) [4]. Ultra-widefield fundus (UWF) imaging is a relatively new technique that can get images of 200° of the retina. It is widely available, fast, and does not require either contact nor mydriasis. Ohno-Matsui et al. [3,5] found the edge of the staphyloma on Optos fundus images (Optos Daytona; Optos PLC, Dunfermline, UK) could show a pigmented or depigmented boundary, which was highly correlated with the outpouching edge of the globe wall on the 3D MRI image, so it might be feasible to use UWF measure the area of posterior staphyloma.
In 2014, Ohno-Matsui [5] simplified the 10 classifications of staphyloma by Curtin [2] in 1977 into six types based on the 3D MRI and Optos imaging as well as the location and distribution of the outermost contour of the posterior staphyloma. The type I and type II staphyloma in Curtin’s classification were renamed as wide macular type and narrow macular type. Ohno-Matsui [5] proposed that the macular type was the most common staphyloma (the wide macular type in 74% of staphyloma eyes, the narrow macular type in 14% of staphyloma eyes). Ohno-Matsui et al. [3] also reported the percentage of macular type was up to 94% in another study. Because the macular staphyloma usually has worse visual acuity and is more prone to myopic maculopathy [6], it is important to quantify the macular staphyloma and study the associated factors.
Materials and Methods
The procedures in this study conformed to the tenets of the Declaration of Helsinki, that was approved by the Ethics Committee of the He Eye Specialist Hospital, Shenyang, China and by the Institutional Review Board of the He Eye Specialist Hospital (No. AF/07.08/02.1). Written informed consent was waived due to the retrospective design of the study.
A database search of imaging reports at He Eye Specialist Hospital was performed using “posterior staphyloma” as the keyword. The charts of all patients with posterior staphyloma seen between January 2020 and December 2020 were gathered. Posterior staphyloma was defined as “an outpouching of the wall in the eye with less radius of curvature compared to the surrounding curvature” [7]. The pigmentary abnormalities on the Optos images were used to ascertain the border of a staphyloma [3,5]. We only collected macular staphyloma (wide and narrow macular type) for the correlation analysis between staphyloma area and central foveal thickness (CFT), subfoveal choroidal thickness (SFCT), subfoveal scleral thickness (SFST). Exclusion criterion included: eyes with a history of vitrectomy, buckling, or corneal surgery; eyes with macular hole, choroidal neovascularization, foveal retinal split, or macular edema; blurry scanning laser ophthalmoscope or OCT images; and posterior staphyloma without involvement of the macula.
All patients underwent a detailed ophthalmological examination and Optos fundus imaging, including best-corrected visual acuity (BCVA) measurement using the Snellen chart, slit-lamp biomicroscopy, and indirect ophthalmoscopy through dilated pupil. Pseudocolor fundus images were recorded by an Optos scanning laser ophthalmoscope (Optos Daytona P200T, Optos PLC). The fundus autofluorescence images and near-infrared images were also obtained in some patients. As a routine imaging protocol, 512 × 128 mode and 21 lines enhanced depth imaging mode through the foveal were obtained on spectral domain OCT (SD-OCT; Cirrus HD-OCT5000, Carl Zeiss Meditec, Dublin, USA).
The data was collected from every patient’s record including age, sex, ethnicity, BCVA, and AL. The corneal curvature K1 (minimum corneal curvature) and K2 (maximum corneal curvature) were measured by the IOLMaster 700 (Carl Zeiss AG, Jena Germany). Image data was measured by two experienced retinal specialists (XZ and AZ), taking note of CFT, SFCT, and SFST on enhanced depth imaging OCT. According to the International Photographic Classification and Grading System of Myopia and Macular Disease, all eyes were classified into five categories of myopic maculopathy atrophy-based classification including “no myopic retinal degenerative lesion (category 0),” “tessellated fundus (category 1),” “diffuse chorioretinal atrophy (category 2),” “patchy chorioretinal atrophy (category 3),” and “macular atrophy (category 4)” [8].
Macular staphyloma area (MSA) was measured and calculated on UWF image by its own software. The staphyloma was outlined according to the obvious change of pigmentary abnormalities [3,5] combined with the curvature of retinal and choroidal vessels meaning the slope of retina (Fig. 1), the edge of staphyloma would be checked on SD-OCT when it was not clear on UWF images, as an irregularly shaped Bruch’s membrane curvature at the ectasia margin on OCT images would be observed [9].

Ultra-widefield fundus scanning laser ophthalmoscope (Optos Daytona; Optos PLC, Dunfermline, UK) imaging. The pigmentation along the edge of the posterior scleral staphyloma was drawn to indicate the size of the macular staphyloma area (pixels, 2). Informed consent for publication of the clinical images was obtained from the patient.
The pixel area would be transferred to mm2. Because the resolution of the Optos image is 14 microns, the actual MSA is the pixel area multiplied by the square of 14, then divided by 106 to get the actual area in mm2.
Statistical analysis
The data was analyzed by IBM SPSS ver. 24.0 (IBM Corp., Armonk, NY, USA). The area of posterior staphyloma was tested by the Shapiro-Wilk normality test. The inter-observer and intra-observer repeatability was expressed by the intraclass correlation coefficient (ICC). If 0.80 ± 1.0, it is considered excellent. Spearman analysis or Pearson analysis were used to assess the correlation among MSA, age, BCVA, AL, K1, K2, CFT, SFCT, and SFST. The t-test were used to assess the correlation between MSA and sex. A one-way ANOVA was used to compare MSA among five categories of myopic maculopathy. Multiple linear regression analysis was fitted for the associated factors with the MSA. A p-value of less than 0.05 was considered statistically significant.
Results
A total of 135 eyes from 92 patients with macular staphyloma were included in this study, with a female predominance (65.9%). All patients were Asians (Chinese origin). The mean age was 64.73 ± 10.84 years (range, 28 to 85 years). The mean AL was 29.92 ± 2.46 mm (range, 24.50 to 35.66 mm). AL shorter than 26.5mm was found in 10 eyes (7.4%). The mean MSA on UWF images was 279.67 ± 71.70 mm2. The mean CFT, SFCT, and SFST were 188.51 ± 51.39, 65.88 ± 47.21, and 241.04 ± 48.39 μm, respectively (Table 1). The ICC of MSA measured by two experienced physicians (XZ and AZ) was 0.965 (95% confidence interval [CI], 0.946 to 0.977; p < 0.001) (Fig. 2).

Univariate and multiple linear regression analysis for the associated factors of MSA
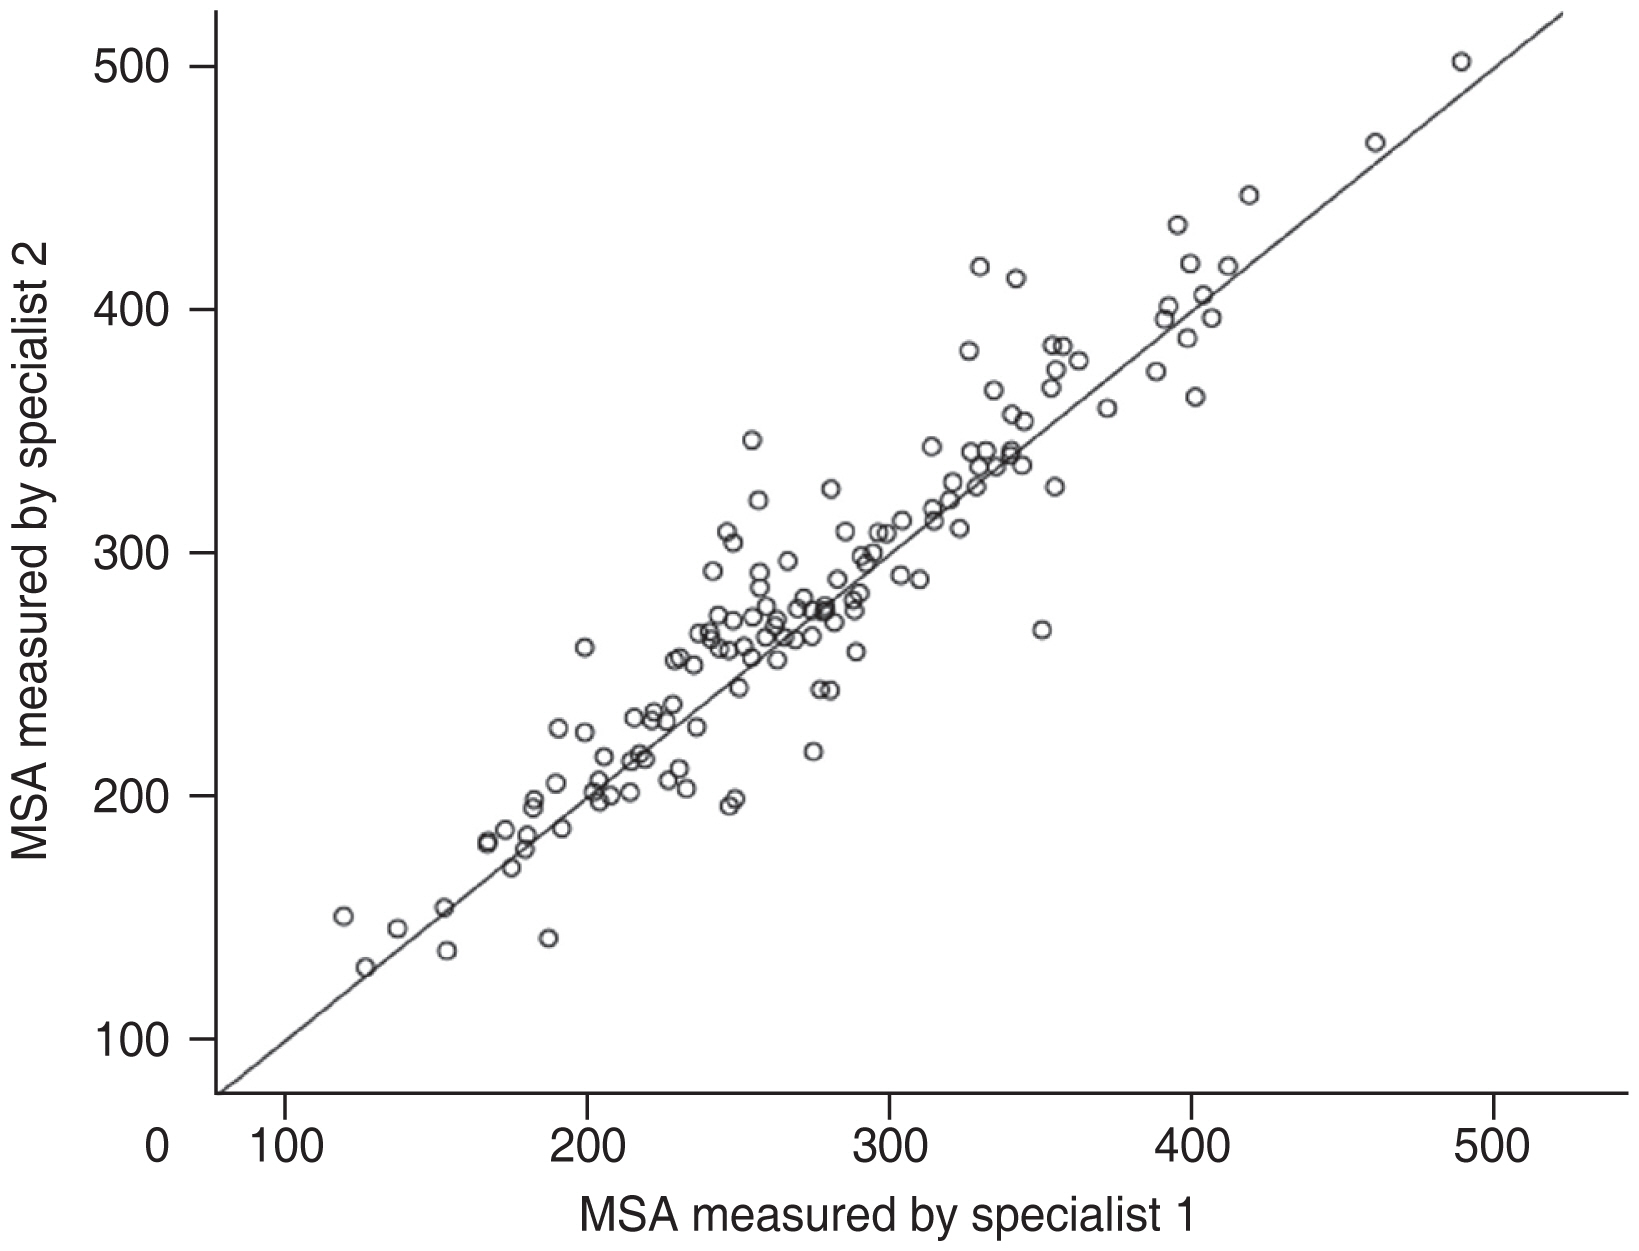
Intraclass correlation coefficients of macular staphyloma area (MSA) measured by two retinal specialists.
Regarding the MSA in the subgroups (categories 1 to 4), significant difference was found when category 4 was compared to other categories (category 4 vs. 1, p < 0.001; category 4 vs. 2, p < 0.001; category 4 vs. 3, p = 0.006), as well as category 1 compared to category 3 ( p = 0.008) (Table 1). However, no significant difference was observed when category 2 paired comparison with other categories (category 1 vs. 2, p = 0.155; category 2 vs. 3, p = 0.096) was performed (Fig. 3).
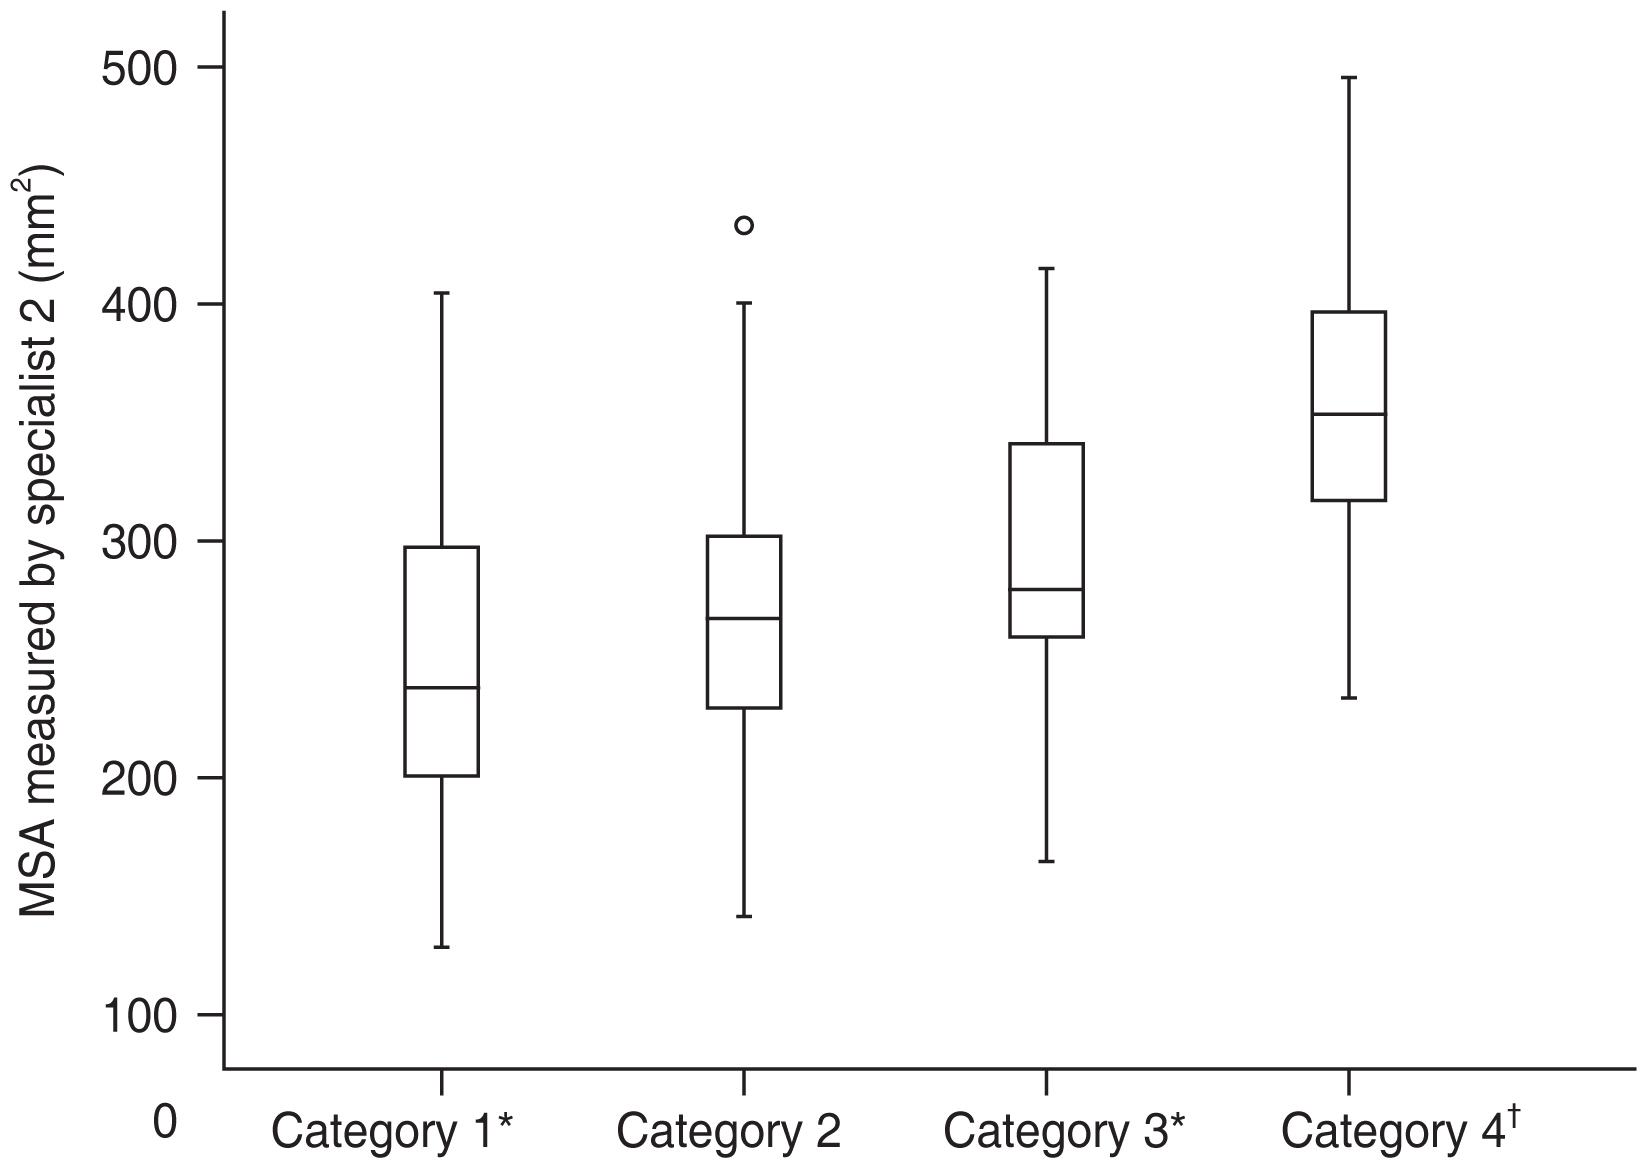
Macular staphyloma area (mm2) among the four categories (category 1, tessellated fundus; category 2, diffuse chorioretinal atrophy; category 3, patchy chorioretinal atrophy; category 4, macular atrophy) of myopic maculopathy. *Category 1 compared with categories 3 and 4; p < 0.05; †Category 4 compared with categories 1, 2, and 3; p < 0.05.
In the multiple linear regression analysis, after adjusting for SFCT, BCVA, CFT, and SFST, the factors independently related to MSA were AL (β = 8.352; 95% CI, 3.306 to 13.398; p = 0.001), sex (β = −26.673; 95% CI, −51.759 to −1.586; p = 0.037), age (β = 1.184; 95% CI, 0.020 to 2.348; p = 0.046) (Table 1). MSA was positively correlated with AL (Fig. 4) and age (Fig. 5).
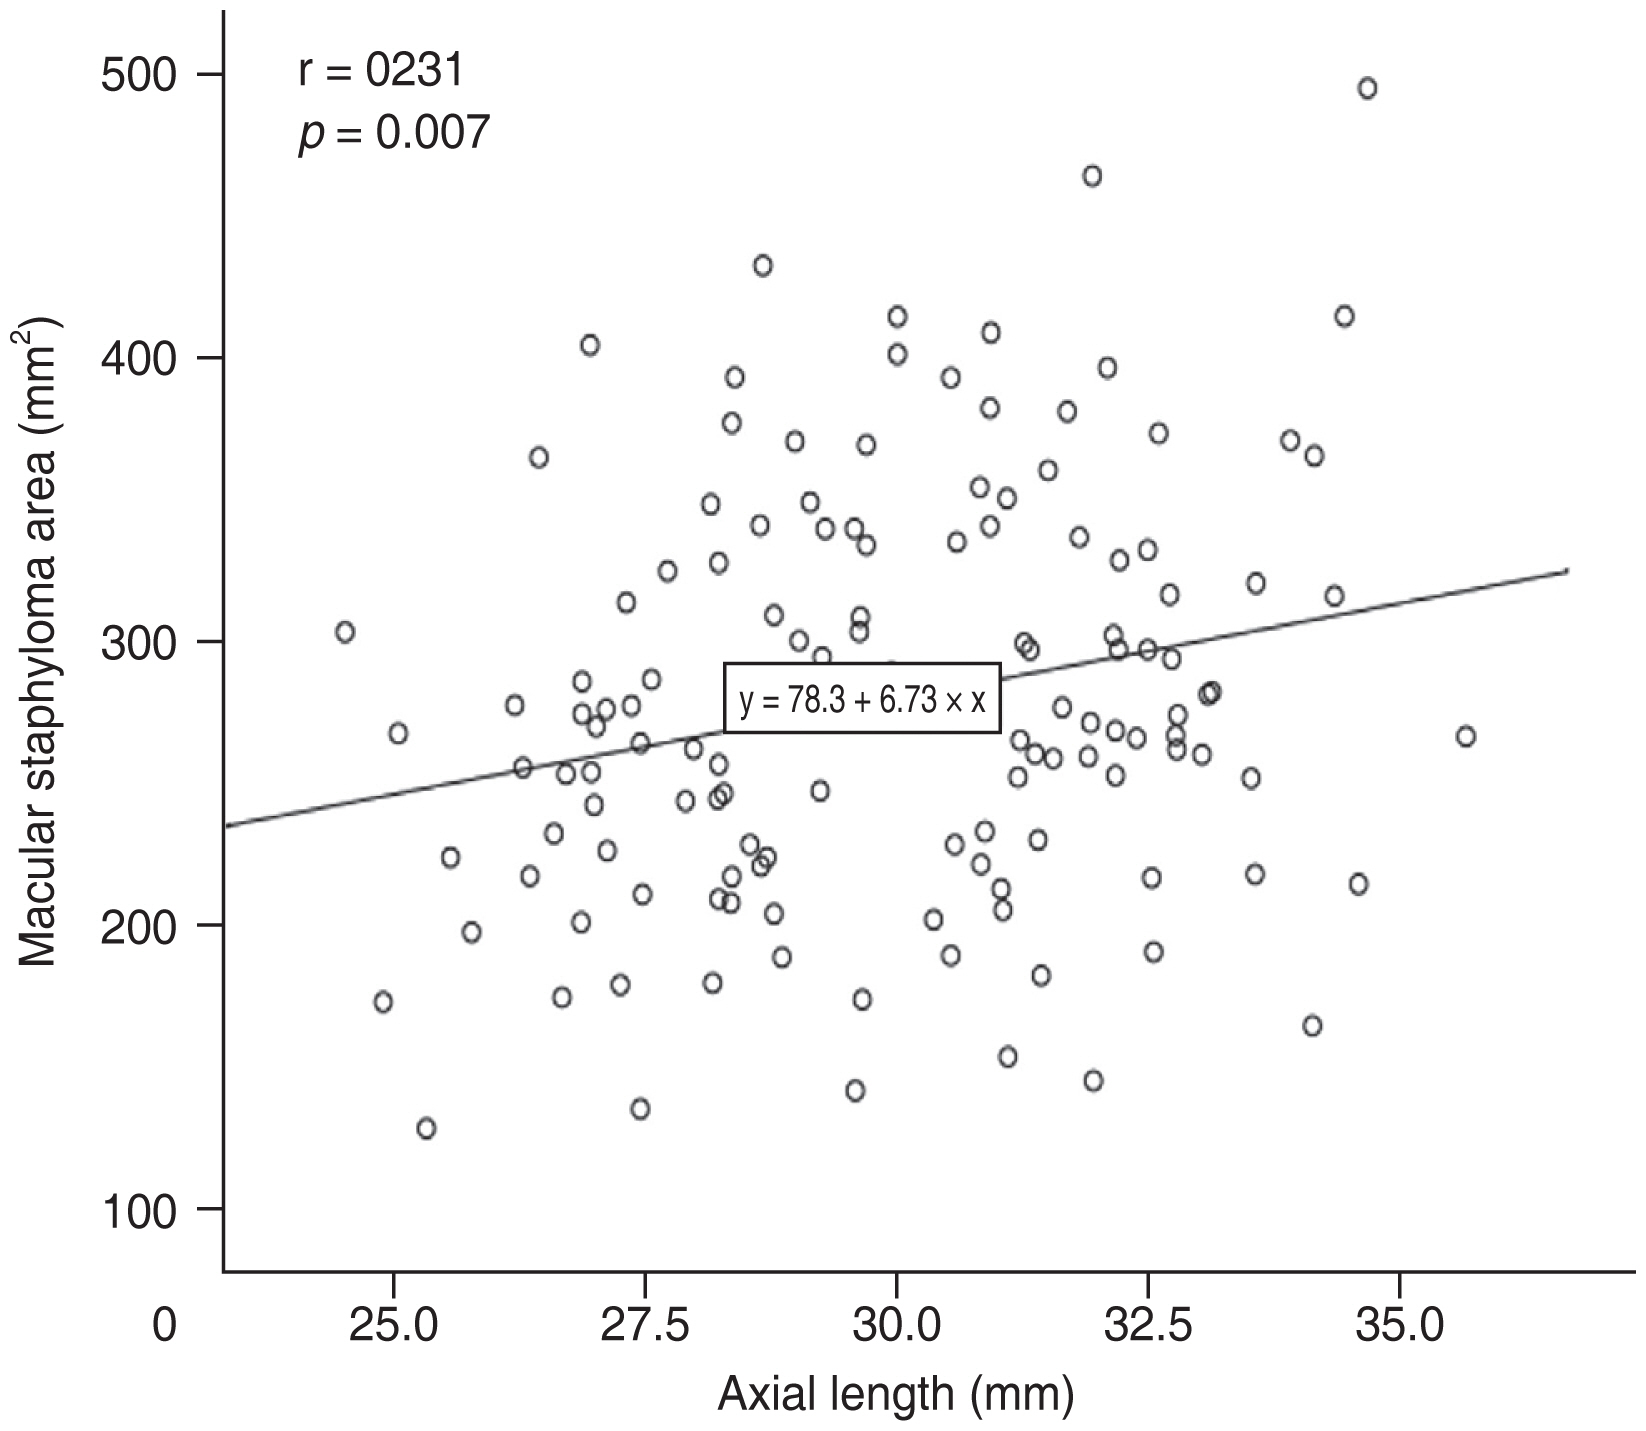
Correlation between axial length and macular staphyloma area.
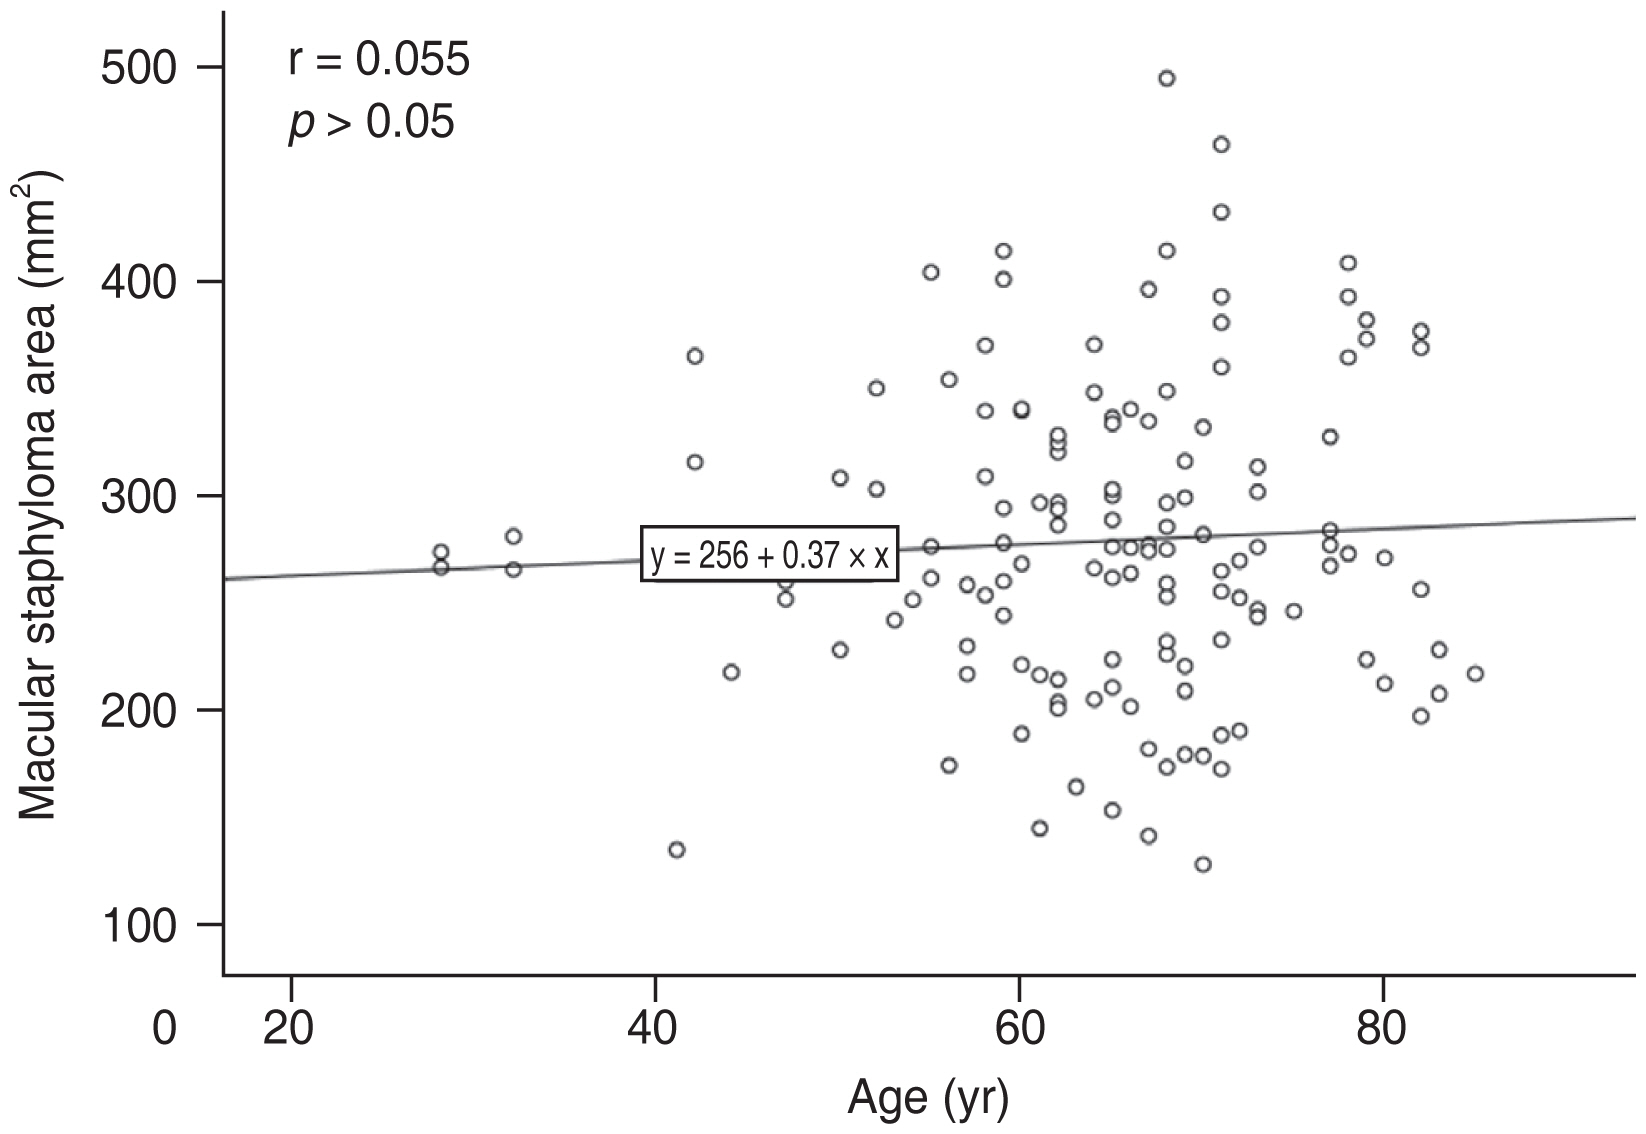
Correlation between age and macular staphyloma area.
Discussion
Posterior staphyloma is histologically characterized by relatively abrupt scleral thinning beginning at the margin of the staphyloma, the presence of structural defects in the arrangement of scleral collagen fibers, and marked choroidal thinning. Choroidal thinning was most pronounced at the posterior staphyloma margin and secondary to axial elongation of the eye. The important cause of myopic maculopathy is posterior staphyloma, which can also be found in the eyes without significant choroidal thinning such as retinitis pigmentosa or Bruch’s membrane limited defects [10].
There are limited population cohort studies on the epidemiologic data of posterior staphyloma, and its prevalence varies from 0.6% to 2.05% [11–13]. The prevalence of posterior staphyloma varies from 19% to 90% in highly myopic eyes [9]. Posterior staphylomata can be a challenge for conventional fundus images because the 50° field of the camera does not always involve their borders. Optos UWF imaging is an advantageous device for detecting the whole area of the staphyloma because of its wide view field and its multimodal features could help maximize the sensitivity of detection. The diagnosis of posterior staphyloma on this convenient device has already been testified [3,5,14]. Ohno-Matsui [5] found a sensitivity of 85% and a specificity of 85.7% for detecting staphyloma borders by using a combination of pseudocolor, autofluorescence, and near-infrared images.
In this study, we outlined macular staphyloma on UWF image based on the pigmentary abnormalities along the staphyloma edge [3,5]. Some people would argue the accuracy of this measurement, because sometimes it is not obvious that the inferior edge is there. Ohno-Matsui et al. [3,5] reported that the pigmentary abnormalities along the staphyloma edge on the Optos 200Tx retinal images were highly correlated with the outpouching edge of the eye in the 3D MRI images. We also used SD-OCT to check the edge of staphyloma in the ambiguous part [9]. Two experienced retina specialists measured the area in this study, and ICC was high.
Some research reported that the grade of posterior staphyloma had a linear relationship with chorioretinal atrophy [15]. Miyake et al. [16] found that eyes with chorioretinal atrophy exhibited a curved, steep shape with an undulated surface. Similarly, we found that the degree of chorioretinal atrophy was positively correlated with MSA in this study.
Although AL was reported to be not correlated with presence of posterior staphyloma in several studies [2,3,17], different types of staphyloma were involved in those studies. In contrast, Jonas et al. [18] found the prevalence of scleral staphyloma increased significantly with the increase of the eye axis. Wakazono et al. [19] also found AL significantly affected the speed of the posterior pole shape change. The measurement of AL is usually through the macula, and the macular outpouching would elongate the ocular axis. The length of the ocular axis is significantly positively correlated with the MSA in this study. Excessive axial elongation may initiate stress at the posterior pole, which may lead to localized degeneration of the sclera, retina, and/or choroid. Either of these degenerative changes could cause pathological changes in other tissues [6]. However, staphyloma also occurs in nonhigh myopic eyes [20,21]. We also found AL shorter than 26.5 mm was in 7.4% of the eyes with macular staphyloma, which suggests other factors associated with staphyloma.
In this study, age was found as another positive factor correlated with MSA. Various studies have reported that the incidence or prevalence of myopic posterior staphyloma is positively correlated with age [3,9,21–27]. Liu et al. [13] found that myopic retinopathy (i.e., staphyloma, myopic choroidal atrophy, lacquer cracks, Fuchs spot) was associated with increasing age. Degenerative changes were common in staphyloma eyes of people over 40 years old, followed by increasing age [2]. Interestingly, we also found the mean age of patients with AL shorter than 26.5 mm was older compared to other patients (73.10 ± 7.05 years vs. 64.06 ± 10.83 years) in this study, the increasing age might be the reason of the formation of staphyloma in these normal AL eyes. Previous studies had found increasing age and AL were relevant risk factors for developing lesions in high myopia patients and in eyes with progressive staphyloma [28–31]. In the patients aged 60 to 86 years, the prevalence of posterior staphyloma rose to 53.5% [2].
In addition, we also found that sex was also an independent factor affecting MSA. Female patients tended to have a larger MSA. According to previous studies, myopic maculopathy progression was associated with female sex in a late myopic stage, and the staphyloma shape was steeper and less smooth in female and elderly patients [9,19,20].
So far, there is no hypothesis that explains the mechanism of total posterior scleral staphyloma formation. In the eyes with high myopia, posterior staphyloma appears to be associated with scleral structural defects, including diffuse localized thinning, thinning of collagen bundles, greater interfibrillar separation, reduced collagen striations, and a lamellar structure resembling the corneal stroma that appears to slide the scleral lamellar [32]. Jonas et al. [18] suggest that significant scleral thinning results from decreased scleral local resistance to backward push of Bruch’s membrane, leading to localized outpouching of the sclera. Some studies have shown that the AL and age are independent related factors that affect the thickness of the foveal sclera [33]. According to clinical experience and previous research, the retinal thickness could reflect the degree of posterior scleral staphyloma to a certain extent [34,35]. The depth of the staphyloma was related to the extent of scleral thinning. Posterior staphyloma is frequently associated with chorioretinal atrophy [2,36]. However, choroidal thickness was not significantly different between staphylomatous eyes and highly myopic control eyes in corresponding regions after adjusting for age and AL [21]. Compared to the data of normal eyes in previous studies [37–40], CFT, SFCT, and SFST were also thinner in the eyes with macular staphyloma in this study, but the regression analysis did not find that CFT, SFCT, and SFST could be considered as independent factors affecting the size of the staphyloma.
This study has several limitations, including a relatively small study population and no 3D MRI images. Because of the bowl shape of staphyloma, we could not measure the true area of staphyloma. The UWF image just reflected the 2D image of staphyloma. This problem also occurs in other retinal measurements due to ocular curvature, such as geography atrophy measurement lots of studies have done before. Because the position of staphyloma would influence the size measurement on UWF images, we only selected the macular staphyloma to maximumly reduce this bias. Fortunately, the ICC in this study is excellent; it is reliable in reflecting MSA. However, it should be mentioned that the value corrected through the projection was not obtained because the area might be affected by the warpage depending on its size and position. The correlation between MSA and posterior staphyloma height, foveal curvature, and some plus signs, such as choroidal neovascularization and lacquer crack, should also be further studied in the future. To the best of our knowledge, this is the first study to measure the staphyloma area using UWF imaging. This study is also void of any bias from pharmaceutical sponsorship.
In conclusion, our data suggests that it is feasible to measure MSA on UWF images, that could be helpful to the study of staphyloma in the future. A larger MSA is associated with female sex, longer AL, and older age.
Acknowledgements
None.
Notes
Conflicts of Interest: None.
Funding: This study was supported in part by the National Science Foundation of Liaoning Province, China (No. 2020-MS-360) and Science and Technology Program of Shenyang, China (No. 20-205-4-063). However, the funding organization had no role in the design or conduct of this research.