

Glaucoma is a leading cause of irreversible blindness and is thought to arise primarily as a result of structural changes in the lamina cribrosa (LC) of the optic nerve head (ONH) [1,2,3]. With the advent of optical coherence tomography (OCT), numerous studies have been performed to characterize the structure of the LC in glaucomatous eyes [4,5,6]. In comparison with normal eyes, the LC was thinner in glaucomatous eyes [7] and was also found to be posteriorly displaced, which is accompanied by enlargement of the optic disc cup, as observed on stereoscopic examination of the ONH [8,9,10].
Previous studies show posterior displacement of the LC to occur prior to the development of retinal nerve fiber layer (RNFL) defects in the glaucomatous ONH [11] and show the degree of posterior displacement to be greater in eyes with visual field (VF) defects than in eyes without VF defects [10]. While a relationship between greater LC depth (LCD) and a faster rate of RNFL thinning has been reported in patients with glaucoma [12,13,14], several other studies find no relationship between LCD and glaucomatous functional status [15]. As glaucomatous structural change precedes functional deficit, these results suggest that posterior displacement of the LC may occur in the early stages; as the disease progresses, VF deterioration progresses further even though the LC may remain in the same position. On the basis of these data, we hypothesize that the posterior movement of the LC may be a predictor of subsequent VF progression. In this study, we explored the longitudinal changes in LCD in glaucomatous eyes by reviewing serial images obtained from spectral domain (SD)-OCT enhanced depth imaging (EDI) scanning. In addition, we explored the factors associated with VF progression in glaucomatous eyes, including LCD change.
Materials and Methods
Subjects
The data were collected from an ongoing basis with 6month interval. We performed a retrospective review of the medical records of all subjects who had attended the glaucoma clinic at the Asan Medical Center, Seoul, Republic of Korea from March, 2011 to June, 2016. At the first visit, all subjects underwent a comprehensive ophthalmologic examination including a review of medical and ophthalmic history, measurement of best-corrected visual acuity, slit-lamp biomicroscopy, Goldmann applanation tonometry, gonioscopy, central corneal thickness assessment (DGH-550 instrument; DGH Technology, Exton, PA, USA), funduscopic examination, axial length (IOLMaster; Carl Zeiss Meditec, Dublin, CA, USA), stereoscopic optic disc photography, red-free photography, standard automated perimetry (Humphrey Field analyzer [HFA] with Swedish Interactive Threshold Algorithm standard 24-2 test, Carl Zeiss Meditec), and ONH imaging with a SD-OCT (Heidelberg Engineering, Dossenheim, Germany). For study inclusion, participants were required to have a best-corrected visual acuity 20 / 40 or better and normal anterior chamber and open-angle on slit-lamp and gonioscopic examinations. Glaucoma patients were identified by the presence of RNFL defects on red-free photography or the presence of glaucomatous optic disc changes on optic disc photography (such as enlarged cup-to-disc ratio [>0.7], diffuse or focal neural rim thinning, or disc hemorrhage) and the presence of VF defects that corresponded with RNFL defects and optic disc changes. All subjects were followed up at 6-month intervals with stereoscopic optic disc photography, red-free photography, VF testing, and ONH imaging with SD-OCT. All tests were performed at the same visit or within 2 weeks; individuals had ≥2 years follow-up, with at least four qualified images obtained at different visits. All accepted images exhibited a centered optic disc, were well focused, and had even and adequate illumination. Subjects with any ophthalmic or neurologic disease known to affect ONH or VF were excluded. Patients who underwent intraocular surgical treatment during follow-up but had >2 years follow-up prior to surgery, were included in the study (only data obtained prior to surgery were analyzed). The study was approved by the institutional review board of the Asan Medical Center (2014-0311), and the study design conformed to the Declaration of Helsinki. Informed consent was waived due to the retrospective nature of the study.
Assessment of LC change by SD-OCT
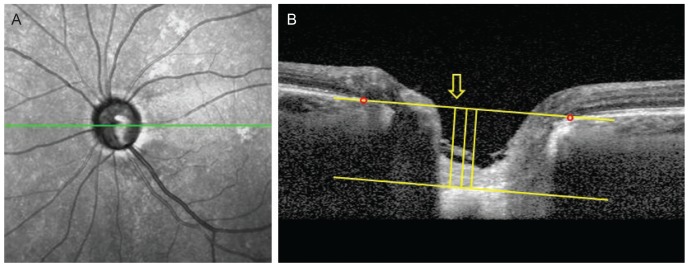
The ONH was examined using SD-OCT EDI scanning at each visit. Two experienced observers (YNK and JWS) manually measured the LCD within the ONH using ImageJ software ver. 1.48 (National Institutes of Health, Bethesda, MD, USA; http://imagej.nih.gov/ij). Briefly, the entire optic disc was scanned using a 6-mm line (512 A-scans) with an interval of 50 µm. In our study, an average of 35 horizontal B-scans was produced in EDI mode. From these B-scans, five frames (center, mid-superior, superior, mid-inferior, and inferior) that passed through the optic disc were selected. The structure of the optic disc was analyzed with the intrinsic viewer. The Bruch's membrane opening (BMO; two red points in Fig. 1A, 1B) was defined by the proximal tips of the Bruch's membrane and a line connecting the BMO on each side was regarded as the BMO plane. The anterior LC surface was set as the horizontal margin where the highly reflective region beneath the optic disc cup started. The maximum perpendicular depth from the BMO plane to the anterior LC surface was measured. The depths were measured from two additional points 100 and 200 µm from the maximum distance point to the temporal direction. The average of three depths was defined as the LCD of each frame. Since the nasal part of the anterior LC surface was usually indistinguishable due to the shadow of the central vessel trunk, only temporally adjacent points were considered. The LCD of each eye was determined by averaging the LCD values from the 5 selected frames at each visit. The mean of the two values obtained from each examiner was used in the main analysis. Details of the measurement have been described previously [16]. Before the main analysis, inter-examiner and intra-class correlation coefficients were calculated using 25 randomly selected images to test reproducibility.
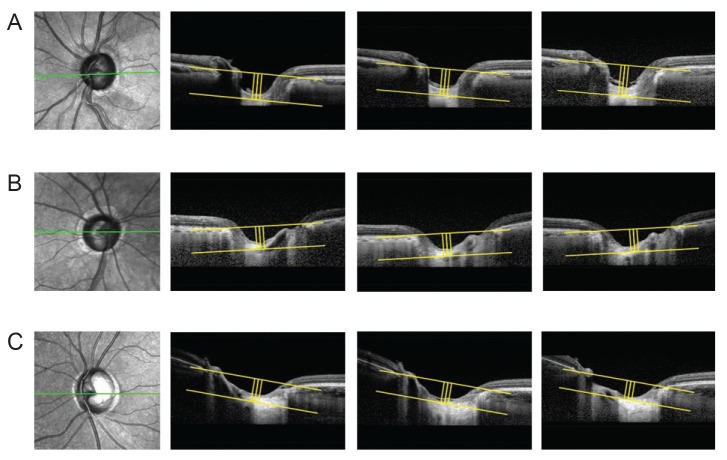
A statistically significant change in LCD was determined by event-based analysis and the criterion for meaningful change was distinguished by the value of the reproducibility coefficient (RC). The RC value was considered as the value under which the difference between any two repeat measurements on the same subject fell with 95% probability, and was calculated as 1.96 × √2 × (standard deviation of LCD change), 23.08 µm [17]. Comparing the LCDs between the baseline and latest two consecutive visits, the subjects were classified into three groups. Eyes with an increase of LCD >23.08 µm or decrease of LCD <−23.08 µm were classified as the increased LCD (ILCD) group or decreased LCD (DLCD) group, respectively. The remaining eyes were classified as the no LCD change (NLCD) group. Representative examples are shown in Fig. 2A-2C.
Analysis of VF progression in glaucomatous eyes
Standard automated perimetry was performed with a HFA Swedish Interactive Threshold Algorithm standard 24-2 test at each follow-up visit at least 6 months apart. Using these data, the Early Manifest Glaucoma Trial criteria were used to define VF progression during follow-up [18]. The rate of visual field index reduction, determined by a negative linear slope from guided progression analysis in the HFA, was also estimated.
Statistical analysis
The Shapiro-Wilk test was performed to confirm the normality of the variables. Since none of them were verified to be significant, the normal distribution of the variables was assumed. Baseline characteristics were subsequently compared among the three groups using ANOVA (post hoc analysis, Tukey's test). Kaplan-Meier survival analyses were conducted to explore and compare the cumulative probability of VF progression among the three groups (log-rank test). The hazard ratios (HRs) of clinical factors for VF progression were evaluated using univariate and multivariate Cox proportional hazard models with the time point of VF progression defined by Early Manifest Glaucoma Trial as a time-dependent covariate. Univariate analyses were performed separately for each variable and factors with a p-value <0.20 were included in multivariate analysis with a ‘forward: conditional method’ to calculate the HRs and 95% confidence intervals (CIs) to identify the inf luential variables for VF progression. All statistical analyses were performed with IBM SPSS ver. 22 (IBM Corp., Armonk, NY, USA) and a p-value <0.05 was considered statistically significant.
Results
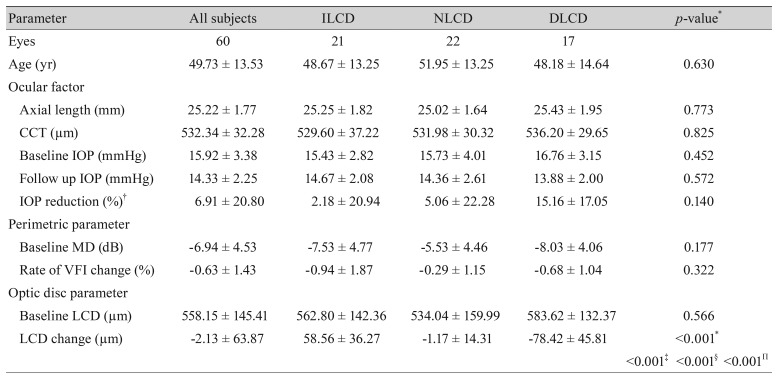
Of the 69 eyes that met the other inclusion criteria, nine were excluded due to poor SD-OCT image quality. Therefore, 60 eyes from 60 primary open angle glaucoma patients (27 male and 33 female) were included in this study; the mean follow-up duration was 3.5 ± 0.7 years. Baseline characteristics are summarized in Table 1. Excellent inter-observer reproducibility was observed (intraclass correlation coefficient = 0.991 [0.986-0.995], p < 0.001).
The assessed eyes were classified into three groups: ILCD (n = 21, 35.0%), NLCD (n = 22, 36.7%), and DLCD (n = 17, 28.3%). Typical images from each group are illustrated in Fig. 2. With the exception of LCD change, there were no significant differences between the three groups in terms of baseline variables such as axial length, central corneal thickness, intraocular pressure (IOP) reduction rate during follow up period, and rate of visual field index change (Table 1).
To compare the cumulative probability of VF progression between the three groups, Kaplan-Meier survival analyses were conducted (Fig. 3). The ILCD group showed a greater cumulative probability of VF progression during the follow-up period than the NLCD (p < 0.001) and DLCD groups (p = 0.018).
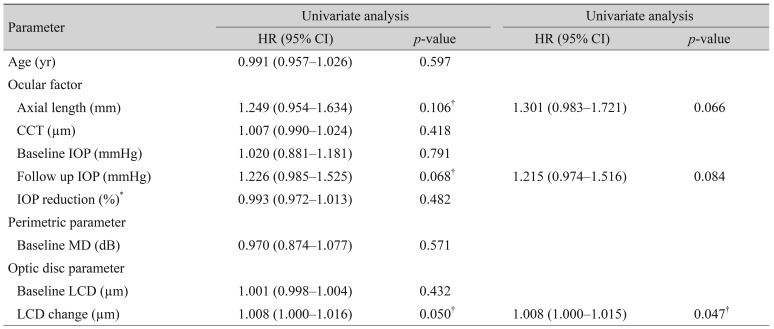
Univariate analysis of Cox's proportional hazard models was used to assess the association between potential risk factors and VF progression (Table 2). Among the baseline parameters, axial length (HR, 1.249; 95% CI, 0.954 to 1.634; p = 0.106), follow-up IOP (HR, 1.226; 95% CI, 0.985 to 1.525; p = 0.068), and the change in LCD (HR, 1.008; 95% CI, 1.000 to 1.016; p = 0.049) showed a possible association with VF progression (p < 0.2). Using these selected variables, multivariate analysis was performed to identify factors associated with VF progression; change of LCD was the only statistically significant variable (HR, 1.008; 95% CI, 1.000 to 1.015; p = 0.047).
Discussion
Posterior displacement of the LC in glaucoma has been described in a range of investigations, including animal models [2,9] and human studies [10,19,20]. Inspired by these previous studies, our retrospective clinical study was designed to determine whether posterior movement of the LC could be a predictor of VF progression in glaucomatous eyes.
In patients with primary open angle glaucoma, we found that the LC moved posteriorly (ILCD group) in 21 eyes examined (35.0%) and anteriorly (DLCD group) in 17 eyes (28.3%) during the follow-up period. The RC value of 23.08 µm was used as a reference value for the classification of the three groups according to the change in LCDs and this value has a similar range of repeatability estimate from that of a previous study [21]. Among the three groups, other than change in LCD, there were no statistically significant differences in investigated parameters, including axial length, IOP and baseline LCD. However, the ILCD group showed a significantly greater probability of VF progression than either the NLCD or the DLCD groups during follow-up when assessed by the Kaplan-Meier survival test.
The observed association between ILCD and VF progression can be explained by the association between deformation of the LC and VF progression, as demonstrated in a previous study [22]. The LC is a sieve-like connective tissue structure through which retinal ganglion cell axons pass as they exit the eye. As it is thought to be the principal site of retinal ganglion cell axonal injury [23,24], posterior LC displacement may impose further compression, extension, and shear stress on the axons passing through the laminar pores resulting in the loss of neuronal function of the axons as well as damage to the capillaries present in the LC [25]. An additional study demonstrated that the region of LC deformation showed good spatial correlation between RNFL loss and VF defect, compared with normal eyes [10,19]. Therefore, the posterior movement of the LC observed in this study represents an early biomarker of VF progression in glaucomatous eyes.
Interestingly, a substantial portion of eyes showed anterior movement of the LC (28.3%). Although the probability of VF progression was less than that seen in the ILCD group, the DLCD group also showed VF progression to a greater extent than the NLCD group. As glaucoma patients in this study received IOP-lowering treatment during the follow-up period, the anterior LC movement can be considered to occur as a consequence of IOP reduction and be related to scleral expansion, as shown in previous studies [15,26,27,28]. Therefore, VF progression in this group can be interpreted as a progressive worsening of glaucoma despite control of IOP and reduction of LC depth.
Our study has several limitations. When reviewing SD-OCT EDI scanning data retrospectively, we had to exclude 13% of the subjects because image quality was insufficient to identify the deep anatomical structure of the LC. A prospective study is required to optimize the scanning protocol in order to increase the resolution of OCT images. Secondly, there may be a bias in the process of measuring LCD with BMO as a reference plane. Because the choroid lies between the sclera and Bruch's membrane, changes in choroidal thickness due to aging, axial length, or diurnal variations could influence the measured LCD [29,30]. Future study is needed to measure LCD with anterior scleral canal opening as a reference plane, which would exclude choroidal thickness [21]. Thirdly, our study is limited in obtaining only five B-scan frames to measure the LCDs and this may not represent all features of the LCD. Finally, due to the small sample size, subgroup analysis according to the level of glaucoma severity was not conducted. Further investigation will be required to determine the relationship between LC movement and VF progression in patients with pre-perimetric or early and advanced stage glaucoma, as the relationship can be different according to the level of glaucoma severity.
Despite the limitations described above, we believe that our study has strength because we investigated long-term progressive change of LCD compared with previous studies that measured LCD cross-sectionally or for a relatively short-term period [10,21]. In conclusion, the assessment of LCD change can be a useful biomarker to predict future VF progression in glaucoma patients. In particular, posterior movement of the LC was associated with a higher risk of subsequent VF progression.

 PDF Links
 PubReader
 Full text via DOI
 Full text via PMC
 Download Citation
 Print
Print


