

Pituitary adenoma (PA) is a common benign monoclonal neoplasm that accounts for approximately 15% to 20% of primary intracranial tumors [1]. Compared with men, women have a two-fold increased risk of developing PA [2]. This condition develops as a non-malignant tumor that grows from the frontal lobe adenohypophysis cells of the hypophysis [2]. It is the most common pathological process in sella turcica, but no scientifically-based environmental risk factors have been identified [2,3,4].
Pituitary tumors can be subdivided into non-secretory (non-functioning) and secretory (functioning) types. Secretory PAs become symptomatic because they secrete hormones. Non-secretory pituitary tumors might grow slowly, compress the optic chiasm, which is directly above the pituitary gland, and cause progressive visual loss [2]. Adenomas are classified according to size into microadenomas (smaller than 1 cm) and macroadenomas (larger than 1 cm). Microadenomas have less of an effect on the visual system or on the function of other glands, whereas macroadenomas can cause visual impairment [5,6,7]. Visual function impairment depends on the PA diameter and its contact with optic pathways. If the PA is small, it cannot reach the optic nerve chiasm, and visual function impairment might not occur [8].
Early diagnosis of PA is essential because long-standing chiasmal compression indicates primary optic atrophy and a poor prognosis for visual recovery following surgical decompression [2]. Detailed visual examination is very important for early PA diagnosis. Various visual functions are tested, including the general health of the visual system, central pathways of vision, and visual system cognitive perception. Studies have shown that visual acuity (VA) assessment using the typical Snellen chart and Landolt rings (Coptotypes) alone is insufficient for visual function testing because it provides limited information about central vision; accurate diagnosis requires both VA determination and contrast sensitivity [9]. The purpose of the present study was to assess visual function (VA, visual field, and color contrast sensitivity) in order to achieve early prediction of chiasma damage in patients with PA. The maximum color contrast sensitivity (MCCS) test is especially useful for follow-up of PA patients after PA surgery. Impairment revealed by the MCCS test could indicate recurrence, which can be confirmed though a brain imaging study.
Materials and Methods
The study group comprised patients (41 patients, 82 eyes) who were referred to the Clinic of Neurosurgery, Hospital of Lithuanian University of Health Sciences, for a consultation with a neuroophthalmologist due to worsened visual function (VA and visual field). All these patients underwent color contrast sensitivity testing, and the diagnosis of PA was confirmed by nuclear magnetic resonance imaging (MRI) of the brain.
The control group consisted of patients who had no ophthalmologic pathology on examination and who agreed to undergo color contrast sensitivity testing. Of the 300 patients who underwent color contrast sensitivity testing, 100 (198 eyes) were included into the control group matched for age and gender to the study group. The patients in the study group were divided into two groups according to PA size. Based on PA diameter, the first group comprised patients with a PA diameter of 1 cm or less, i.e., microadenoma; the second group of patients had a PA diameter larger than 1 cm, i.e., macroadenoma.
The inclusion criteria were as follows: (1) PA determined and confirmed using MRI, (2) generally healthy, (3) consented to take part in the study, (4) age between 18 and 65 years. The exclusion criteria were as follows: (1) contagious eye diseases, high degree of refraction error (patients with high d egree o f myopia ≥6.0 d iopters a nd a high degree of hyperopia ≥5.0 diopters), or lens opacities (nuclear, cortical, and posterior subcapsular cataract) except minor opacities, keratitis, acute or chronic uveitis in anamnesis, glaucoma, optic nerve disease, retina central part degenerations or dystrophy; (2) systemic disease (diabetes, oncological disease, systemic connective tissue disease, and chronic infectious disease, state after the tissue or organ transplant); (3) other brain tumors; (4) congenital color vision deficiency; and (5) patient refusal to participate in the study.
Healthy patients with no ophthalmological eye disorder based on detailed ophthalmological evaluation were included if they did not have any eye disorders (patients with any refractive error were not included in the study) or if they were taking epileptic or sedative drugs.
In this research, non-corrected and best-corrected VA were evaluated using the logarithm of the minimum angle of resolution chart at a standard 4-meter distance from the chart. Refraction was determined during each examination in order to obtain the best-corrected VA. Biomicroscopy was performed to assess corneal and lenticular transparency. The subjects' pupils were dilated with 1% tropicamide. After dilation, funduscopy was performed with a direct monocular ophthalmoscope and a slit-lamp using a double aspheric lens of +78 diopters.
The MCCS test was carried out under artifcial daylight illumination; care was taken to use the same instructions in all testing sessions. The light was directed at an angle of approximately 90° from the patient's side, the viewing angle was about 60° positioned at about 45° to the plate surface without a glare from the monitor.
In the MCCS computer test [10], the subject's task was to determine the correct direction of a bar in a circle, indicated by pressing a button. If the direction was unclear, a blank button was pressed. Each time the button was pressed, a blank screen appeared; 1 second later, another circle with a randomly chosen bar direction was presented. If the direction of the bar in the circle was chosen incorrectly, its color was automatically highlighted. After the direction of the bar was selected correctly, the intensity of its color was automatically dulled; due to the change in intensity of the bar, the brightness of the background of the circle appeared to change. The first correct answer after a series of incorrect answers or the first incorrect answer after a series of correct answers was accepted as the subject's maximum sensitivity to the target color of a bar. When this maximum sensitivity was determined, the color of the bar was changed, and the test was started again. The bar was presented in a total of six colors: red, green, blue, greenish blue, violet, and yellow. Once a subject's sensitivity to all these colors had been assessed, all findings were recorded in a database, and the results of the test were presented in a result window. The grey background luminance of the monitor was 350 cd/m2 [10]. The luminance of the surrounding area was 400 cd/m2 [10].
Statistical analyses were performed to assess the VA of each eye; the visual field and MCCS test results were estimated separately for each eye. Statistical analysis was performed using the SPSS ver. 13.0 (SPSS Inc., Chicago, IL, USA). The data are expressed as absolute number, percentage, or mean and standard deviation (SD). The Mann-Whitney U-test and Kruskal-Wallis test were used to compare the groups. The correlations between PA diameter and MCCS test results, VA, perimetry, and fundus changes were evaluated using Spearman's correlation coefficient. Differences were considered statistically significant at p < 0.05.
Results
A total of 141 participants were enrolled in the study. There were 34 men (34%) and 66 women (66%) in the control group and 8 men (19.5%) and 33 women (80.5%) in the study group. The mean age of the patients with a diagnosis of PA was 51.7 years (SD, 10.4), while that of the control group and 51.4 years (SD, 10.8).
The VA was 0.00 in the control group and -0.04 in the group with PA ≤1 cm (distributed from 0.3 to 0.00). In the group with PA >1 cm, the VA was -0.20 (distributed from 2 to 0.00). The VA was significantly worse in patients with PA diameter >1 cm compared to that of those with PA diameter ≤1 cm (p = 0.0281). VA deficit was found in 50 of the patients (61%) with PA: 34 patients (66%) with PA >1 cm and 16 patients (57%) with PA <1 cm. A weak negative correlation was found (r = 0.341, p = 0.002) between tumor size and VA. VA decreased in 10% of persons with PA diameter ≤1 cm and in 40% of patients with PA >1 cm. There were no blind patients in the PA patients groups.
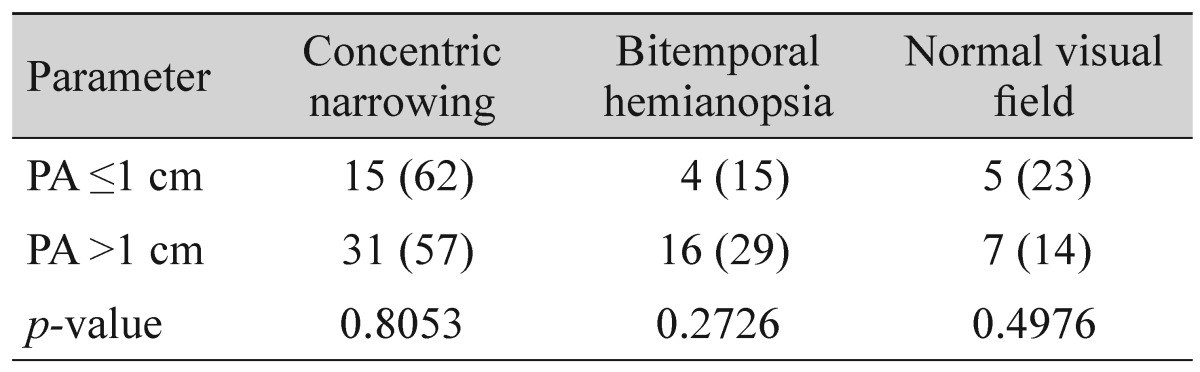
The analysis indicated that 77% of patients with PA ≤1 cm had an affected visual field (concentric narrowing was detected in 62% of patients, bitemporal hemianopia was found in 15% of patients). The visual field was affected in 86% of patients with PA >1 cm (concentric narrowing was detected in 57% of patients, bitemporal hemianopsia was found in 29% of patients) (Table 1). There was no correlation (r = 0.053, p = 0.634) between tumor size and visual field damage.
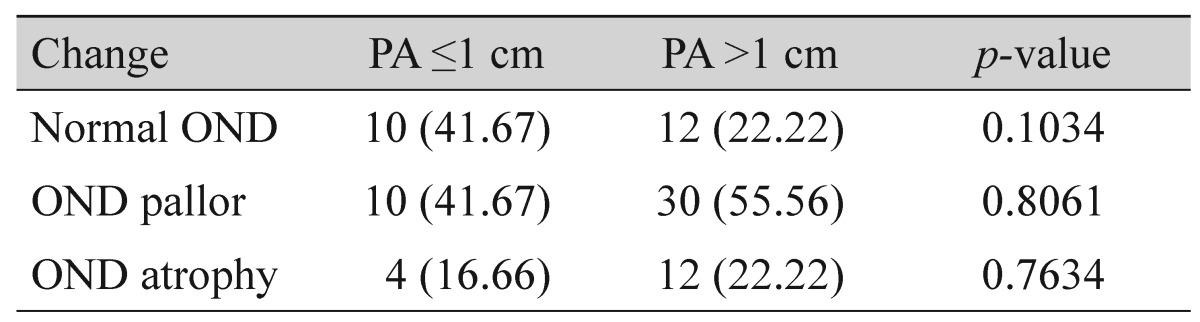
This was the first study to analyze changes to the optic nerve disc (OND) in patients with PA ≤1 cm and >1 cm and in those with hormone-producing PA. The OND was more frequently affected in patients with PA with a diameter greater than 1 cm and in patients with non-functioning PA. The analysis indicated that 16.66% of patients with OND atrophy had a PA ≤1 cm, while 22.22% of patients with PA >1 cm experienced OND atrophy. However, there was no statistically significant difference between these groups (Table 2).
Our research showed that MCCS was affected in 73.17% of individuals with PA. Color contrast sensitivity was affected in 13.3% of patients with PA ≤1 cm and was affected in 81.1% of patients with PA >1 cm. The total error score (TES) of MCCS was 1.8 (SD, 0.38) in the group with PA ≤1 cm, 3.5 in the group with PA >1 cm (SD, 0.96), and 1.4 in the control group (SD, 0.31). The difference between the TES values of MCCS in individuals with PA and the controls was significant (p < 0.001). There was a positive correlation between tumor size and MCCS results (r = 0.648, p < 0.001).
When VA and visual field were normal, the TES MCCS test results were 3.3 (SD, 1.8), compared to 4.6 in those with a VA less than 0.00 (SD, 2.9). Even for PA patients with normal VA, the TES was 2.35 times worse than that of healthy individuals (p < 0.01).
The average diameter of the PA was 2.4 cm in patients with a VA of 0.00 (SD, 1.01), 3.6 cm in patients with a VA in the range of 0.00 to 0.04 (SD, 3.2) (p < 0.01), and 4.83 cm in those with a VA <0.04 (SD, 2.1). The average diameter of the PA was 3.1 cm (SD, 0.95) when the VA was less than 0.00. When the VA was normal, the diameter of the PA was half the size of that of patients with VA <0.04. We grouped all patients in order to calculate the specificity and sensitivity of the MCCS test. According to our data, the sensitivity of this test was 71.95% and the specificity was 75%.
Discussion
PAs are classified based on size into microadenoma (≤1 cm) and macroadenoma (>1 cm). The size of the adenoma corresponds with the compromising effects on the optic chiasm, cranial nerves, and cavernous sinuses, but tumor size does not reflect clinical importance [11]. In addition, macroadenomas can cause local symptoms such as visual disturbances when the optic chiasm is compressed [12]. This classification is supplemented by immunochemistry and functional status. Pituitary tumors are classified as functioning or non-functioning on the basis of ability to produce and secrete mature hormones [13,14]. Patients might experience headaches, visual disorders, and cranial nerve dysfunction from compressive effects, while changes in hormone expression are either due to pituitary stalk disruption or pituitary failure due to compression of normal pituitary tissue [15]. Since MRI techniques have improved and are used more widely in the general population, PAs are more frequently incidentally diagnosed; however, pituitary tumors such as non-functioning PA might not be identified for many years.
In cases of PA, one of the most important aspects of diagnosis is to thoroughly investigate visual function. The complexity of the examination includes VA, perimetry, and fundus examination of both eyes. Although these examination methods are very useful, they do not completely reflect the condition of the visual system. We used the new MCCS test to more accurately examine visual functions in our research. This test is extremely sensitive to the earliest stages of visual function alterations. The qualitative estimation of color contrast sensitivity is very important for diagnosing PA and can provide valuable information for diagnosing the disease and determining progression [16]. These alterations depend on changes in the entire visual tract from the cones in the retina to the cerebral extrastriatal regions [17].
In our research, VA decreases in accordance with adenoma diameter. VA was particularly affected in patients with PA >1 cm. VA deficit was found in 34 patients (66%) with PA >1 cm. This result is in agreement with that of Elgamal et al. [18], who reported VA impairment in 54.8% of patients diagnosed with PA, although the authors did not analyze the dependence of VA on PA diameter or hormone activity. In their study, blindness was determined in three eyes, VA was diagnosed when a patient could only see fingers in front of their eyes, and the results were based on a total of six eyes [18]. There were no blind patients in our study, and the most progressed VA was 0.01. In the study by Elgamal et al. [18], a total of 68 of the eyes with PA were affected either by decreased VA and/or change in the visual field. The main visual presentation in 32 patients was impaired vision (VA, 20 / 50 or greater; 38.7%), and it was bilateral in 16 patients. In the remaining 76 eyes (61.3%), there were no visual symptoms related to the presence of PA. Visual field abnormality was detected in 55 eyes of 29 patients (44.4%), and bitemporal hemianopia represented strikingly abnormal VF in 19 patients (69%) [18]. In a case series by Dhar and Pehere [19], 66 of 114 eyes (57 patients) had normal VA. Additionally, only 16 patients (28.1%) had normal visual fields in both eyes [19]. Therefore, the visual field changes were very similar across all of the studies. A review by Hollenhorst and Young [20] of 1,000 cases of pituitary tumors over a 22-year period indicated that 70% of these patients had either VA loss, visual defects, or both, while only 20% of patients had reduced VA and 32% had visual field defects. The results of this analysis differ only from the case series studied by Anderson et al. [21], where the authors found that only 16% of patients had decreased VA and 32% had visual field defects. Out of 36 eyes studied, 24 (66.7%) had visual field defects at presentation, including 12 eyes (33.3%) with temporal defects, 10 eyes (27.8%) with non-specific defects, and two eyes with peripheral constriction [21]. The most common pattern of visual field loss was bitemporal defects, present in six patients (33.3%) [21]. In another study, eight eyes of four patients (median age, 41.50 years; interquartile range, 33 to 51 years) with PA that caused visual feld defects were reviewed [22]. The transverse dimensions of the tumor on MRI ranged from 2.5 to 4.5 cm in all subjects. All the subjects presented with progressive VA loss, headache, and visual feld defects. The VA defcits ranged from 20 / 60 to 20 / 30 [22]. In our research, when VA was <0.00, the average PA diameter was 3.1 ± 0.95 cm [22].
Optic nerve changes are common in patients with PA. Longstanding compression by pituitary macroadenoma leads to optic atrophy [23]. Dhasmana et al. [23] reported five patients (27.8%) in their series with optic nerve head changes; three patients had unilateral optic atrophy, and two patients had bilateral disc pallor. In our research, there were 12 individuals (22.22%) with OND atrophy among patients with PA >1 cm, and four (16.66%) among individuals with PA ≤1 cm. Elgamal et al. [18] determined that a funduscopic sign of longstanding chiasmal compression from pituitary macroadenoma is primary optic atrophy (secondary to retrograde axonal degeneration). In this group of patients, optic atrophy was seen clearly in 21 eyes (17%), and all of them were found to have significantly affected vision (VA, 20 / 100 or worse). This also reflects the degree of visual recovery following transsphenoidal decompression [18].
In the literature, information about color contrast sensitivity impairment can only be found in conjunction with VA impairment, i.e., in the later stages of PA. Researchers have determined great color contrast sensitivity impairment in patients diagnosed with PA [24]. In Grochowicki et al. [25]'s opinion, the contrast sensitivity examination is a suitable method to determine visual pathway compression. However, it should not be used separately from other examination methods of the visual system.
The decreasing MCCS test results in our study indicated some of the earliest signs of PA in patients with intact VA. It is interesting to note that, even when VA was normal in patients with PA, the MCCS test results were worse compared to those of healthy persons. Furthermore, a decrease in color contrast sensitivity in patients with PA was found in a study using a Farnsworth-Munsell 100 hue test. In the present study, the results were determined according to PA diameter. The PA diameter was 131.79 in patients with PA ≤1 cm (SD, 30.62), while that of patients with PA >1 cm was 244.68 (SD, 51.56; p = 0.011) [26]. Jayaraman et al. [22] also found color vision impairment in one or both eyes in patients with PA. Gupta et al. [27] interpreted the alterations of color contrast sensitivity in patients with hypophysis adenoma as a decrease in the myelination of the vision fibers due to altered nutrition. This can be a primary cause of color sensitivity changes, especially when the tumor is localized in the region of the optic chiasma. In our research, the MCCS was affected in 73.17% of individuals with PA, and the results of the MCCS test were 1.9 times better in patients with PA ≤1 cm compared to patients with PA >1 cm (p < 0.01); even when the VA was normal in PA patients, the group error score was 2.35 times worse compared to that of healthy persons (p < 0.01).
In conclusion, results of a new MCCS test TES were 1.9 times better in patients with PA ≤1 cm compared to patients with PA >1 cm ( p < 0.01). Even when VA was normal in the PA patients group, their TES was 2.35 times worse than that of healthy persons. To our knowledge, this is the first study to analyze color vision abnormalities in patients with PA based on diameter. Therefore, this is the first analysis of visual function dependence on PA diameter. However, there were limitations to this study. Although the TES for the hue test was determined, we did not determine the partial error score for the red-green axis or blue-yellow axis. Future studies can use these parameters to assess the impact of PA on color vision abnormalities.
 PDF Links
 PubReader
 Full text via DOI
 Full text via PMC
 Download Citation
 Print
Print


