Simplified Correction of Ischemic Index in Diabetic Retinopathy Evaluated by Ultra-widefield Fluorescein Angiography
Article information
Abstract
Purpose
To develop a novel, simplified method for correcting the ischemic index of nonperfused areas in diabetic retinopathy (DR).
Methods
We performed a retrospective review of 103 eyes with naive DR that underwent ultra-widefield angiography (UWFA) over a year. UWFAs were graded according to the quantity of retinal non-perfusion, and uncorrected ischemic index (UII) and corrected ischemic index (CII) were calculated using a simplified, novel method.
Results
The average differences between UII and CII in the non-proliferative DR group and the proliferative DR group were 0.7 ± 0.9% in the <25% CII group, 3.0 ± 0.9% in the 25% to 49.9% CII group, and 3.6 ± 0.6% in the >50% CII group, respectively. A CII >25% was critical for determining DR progression (p < 0.001).
Conclusions
Distortion created by UWFA needs to be corrected because the difference between UII and CII in DR increases with the ischemic index.
Fluorescein angiography is a fundamental tool for evaluating the extent of retinal ischemia in diabetic retinopathy (DR). Traditional fluorescein angiography shows only 30° to 40° of the retina; therefore, it does not fully measure the extent of peripheral capillary non-perfusion. Ultra-widefield fluorescein angiography (UWFA) uses the Optos Optomap Panoramic 200Tx (Optos PLC, Dunfermine, Scotland), a scanning laser ophthalmoscope that shows up to 200° of the fundus and captures more than 3.2 times more retinal surface area than the 7 overlaid standard fields (7SFs) using traditional angiography [1]. UWFA utilizes the unique optical properties of a large ellipsoidal mirror, which provides two conjugate focal points. The first 'real' focal point, located high on the ellipsoidal mirror, translates the scanning laser beams into a 'virtual' focal point located posterior to the patient's iris plane. Using this technique, the Optos Optomap provides a 200° field of view.
Studies of central retinal vein occlusion and diabetic macular edema have reported the importance of peripheral capillary non-perfusion using the ischemic index based on UWFA [2,3,4,5]. A direct correlation was seen with ischemic index and in eyes with increasing DR severity [6]. In previous studies, ischemic index was calculated by circling the area of capillary non-perfusion seen in the arteriovenous phase image using the area measurement function and dividing this by the total image area in pixels. However, because the inner surface of the eye is nearly spherical, it cannot be mapped onto a flat surface without distortion [7]. Therefore, the schematic drawing of the fundus (Fig. 1) generates a flat surface on which the radial distances of the drawing are proportional to the arc distance from the posterior pole [7]. This produces azimuthal projection where distances and directions from the fovea, the center point of the eye, are retained [7]. The distortion of projected peripheral images increases with distance from the center. Therefore, this distortion should be corrected to reduce any discrepancy between the measurement of nonperfused areas directly from Optos images, the ischemic index, and the actual dimensions of the eye.
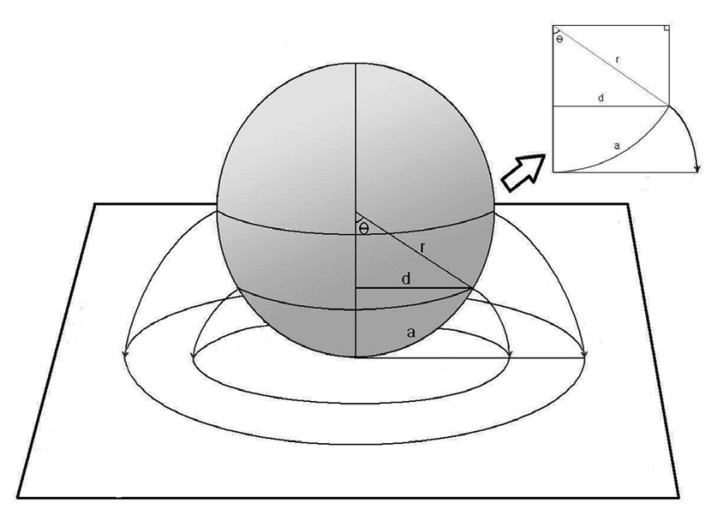
Schematic drawing of the retina and ultra-widefield angiography image. The more peripheral the retina, the greater the distortion of the projected image, resulting in a discrepancy with the actual retina size. θ = median angle of each zone; a = length of the retinal arc on ultra-widefield angiography; sin θ = d / r; d = r × sin θ; a = 2πr × θ / 360°; and d / a = (360° × sin θ / 2πθ).
We demonstrate a simplified approach for correcting distortion of projected UWFA images. The purpose of this study is to introduce a novel, simplified way of correcting the ischemic index, and we use this method to evaluate the correlation between retinal ischemia in DR progression and to explore differences between the uncorrected ischemic index (UII) and corrected ischemic index (CII) for calculated nonperfused areas in DR.
Materials and Methods
We conducted a retrospective review of 132 patients with DR over a 1-year period (January 2012 to January 2013). The definition and classification of DR was in accordance with Diabetic Retinopathy Study and Early Treatment Diabetic Retinopathy Study guidelines. UWFA images were obtained according to a standard clinical protocol in which 5 mL of 10% sodium fluorescein was injected intravenously into each patient. In order to reduce possible artifacts from eyelashes or eyelids and peripheral blurring, we instructed patients to steer their eyes while undergoing UWFA. Images were archived and reviewed using the Optos V2 Vantage Review Software (Optos PLC). The selected UWFA images were subsequently compressed into high-quality JPEG files and were transferred into Adobe Photoshop software (Adobe Systems Inc., San Jose, CA, USA).
Two independent masked reviewers (JK and HJ) selected one or more images from each UWFA series during the arteriovenous phase (between 45 seconds and 2 minutes) and graded them for the presence of retinal non-perfusion. The selected images were verified by a retina specialist (JS). We defined retinal non-perfusion as angiographically significant hypofluorescence.
To calculate the ischemic index, the JPEG images from the Optos (1,400 × 1,400 pixels) were analyzed using Photoshop CS3 (Adobe Systems Inc.). We used 200° of the image and divided it into 10 circles (zones), with zone 1 as the inner most zone and zone 10 as the outermost zone (Fig. 2). The most outer peripheral zone (zone 10) was excluded from ischemia analysis due to uncertainty regarding possible artifacts created during imaging. Two trained reviewers (JK and HJ) independently delineated the ischemic region of each zone (Fig. 2) using the ImageJ program (http://rsbweb.nih.gov/ij/). The sum of ischemic areas from zones 1 to 9 was divided by the total retinal image area in pixels to generate the UII.
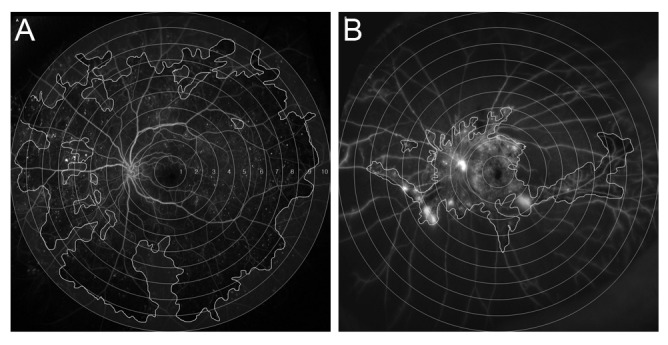
Ultra-widefield fluorescein angiography images of non-proliferative diabetic retinopathy (A) and proliferative diabetic retinopathy (B) used for calculating ischemic index. Each zone is numbered from 1 to 10, and the areas of non-perfusion are shaded.
The CII was calculated using a method that assumed the retina is a complete sphere, where d / a = (360° × sin θ / 2πθ); sin θ = d / r; d = r × sin θ; a = 2πr × θ / 360°, θ = median angle of each zone; and 'a' = length of the retinal arc on UWFA (Fig. 1). Based on the fundamentals of the scanning opthalmoscope, in which the radial distances of the drawing are proportional to the arc distance from the posterior pole, we determined the ratio of 'd' to 'a.' The length of the arc 'a' is the radius of the circular zone on UWFA. We used the median theta from 0° to 90° of each zone since it is not possible to find the exact theta for each ischemic region. Each ischemic area from zones 1 through 9 was multiplied by the correction constant and summed, and then divided by the total area of the hemisphere. Both the UII and CII are shown as percentages.
We excluded eyes with previous retinal surgery, laser treatment, or intravitreal injections, eyes with concomitant non-diabetic diseases (retinal vein occlusion, uveitis, and tumors), eyes with poor photographs due to significant media opacities (vitreous hemorrhage and cataract), and poor patient cooperation. Statistical analysis was performed using SPSS ver. 17.0 (SPSS Inc., Chicago, IL, USA). The Student's t-test was used to compare patient demographic data and an independent t-test was used for comparisons between UIIs and CIIs and eyes with non-proliferative DR (NPDR) and proliferative DR (PDR). The paired t-test and Mann-Whitney U-test were used to compare averaged differences in CII between the two groups.
Results
During the 1-year study period, we reviewed 258 UWFAs from 132 diabetic patients. Of these, we excluded 24 patients due to vitreous or preretinal hemorrhage, 12 due to previous panretinal photocoagulation, 9 due to previous bevacizumab injections, and 8 patients whose eyelid interference precluded sufficient view of the fundus.
We included 62 eyes (43 patients) with treatment naïve NPDR and 41 eyes (36 patients) with treatment naive PDR. The mean visual acuity was 20 / 25 (standard deviation [SD], 0.2) in the NPDR group and 20 / 32 (SD, 0.3) in the PDR group. The mean age of NPDR patients was 59.9 years (SD, 10 years; range, 40 to 83 years) while the mean age for the PDR group was 57.2 years (SD, 9 years; range, 40 to 75 years). Patient demographics are shown in Table 1. The mean UII was 13.9% for the NPDR group (SD, 11.4; range, 0.1% to 42.1%) and 54.2% for the PDR group (SD, 16.8; range, 16.1% to 85.7%; p < 0.01). The mean CII was 13.0% for the NPDR group (SD, 10.6; range, 0.1% to 40.2%) and 50.8% for the PDR group (SD, 16.6; range, 14.2% to 82.8%; p < 0.01) (Table 2). A receiver operator characteristic curve was calculated and a cut-off value of 25% was obtained for the CII, with a sensitivity of 95% and a specificity of 83.9% (p < 0.001). The range of ischemic index in both groups was divided into three subgroups based on CII (Table 3). The average differences between UII and CII in the NPDR and PDR groups were 0.7 ± 0.9% in the >25% CII group, 3.0 ± 0.9% in the 25% to 49.9% CII group, and 3.6 ± 0.6% in the >50% CII group, respectively (Table 3). The average difference between CII and UII in each range was statistically significant (p < 0.001). There were also significant differences in the CII ranges of NPDR and PDR groups (Fig. 3). The median CII in both groups was 22.6%, which was significantly different from the median UII (p < 0.001). The CII and UII in both the NPDR and PDR groups had a statistically significant positive linear correlation (p < 0.001, r = 0.999).
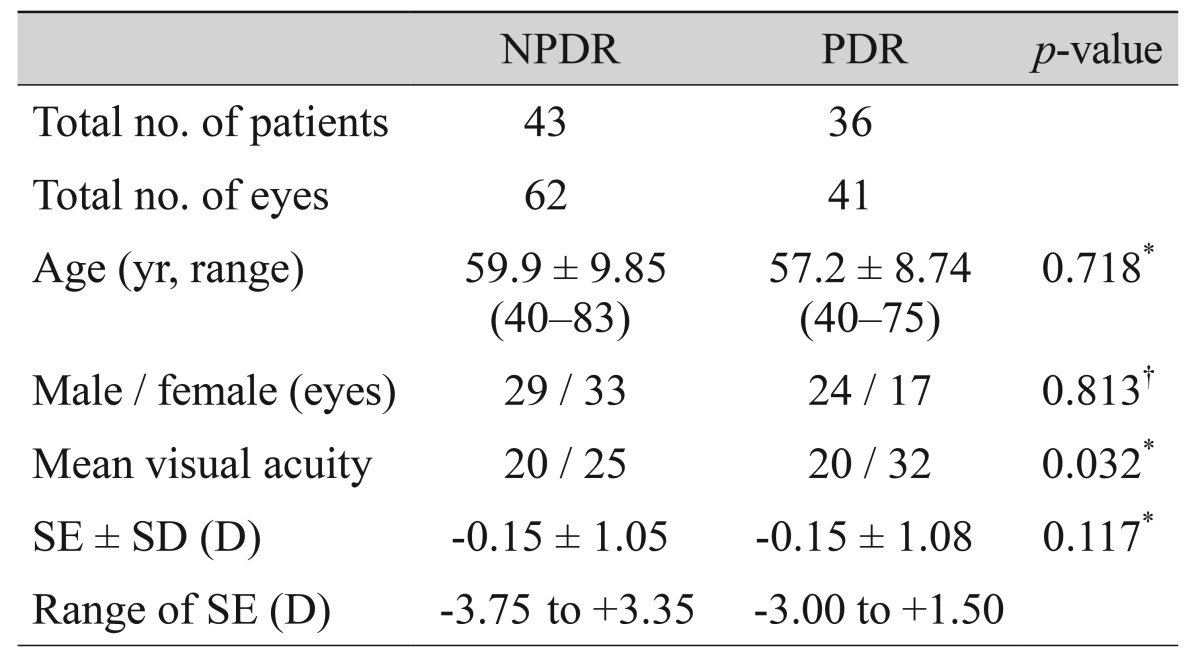
Summary of patient demographic data
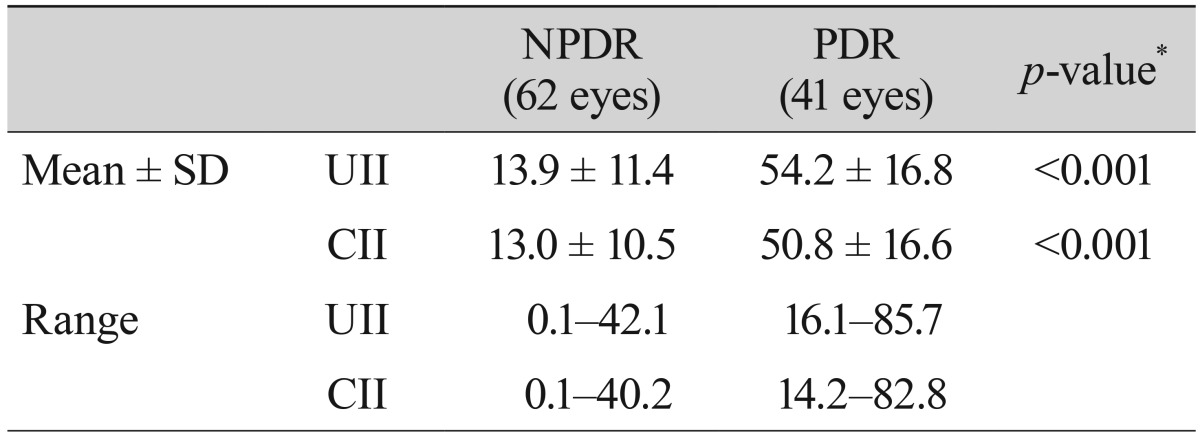
Ischemic index of NPDR and PDR groups
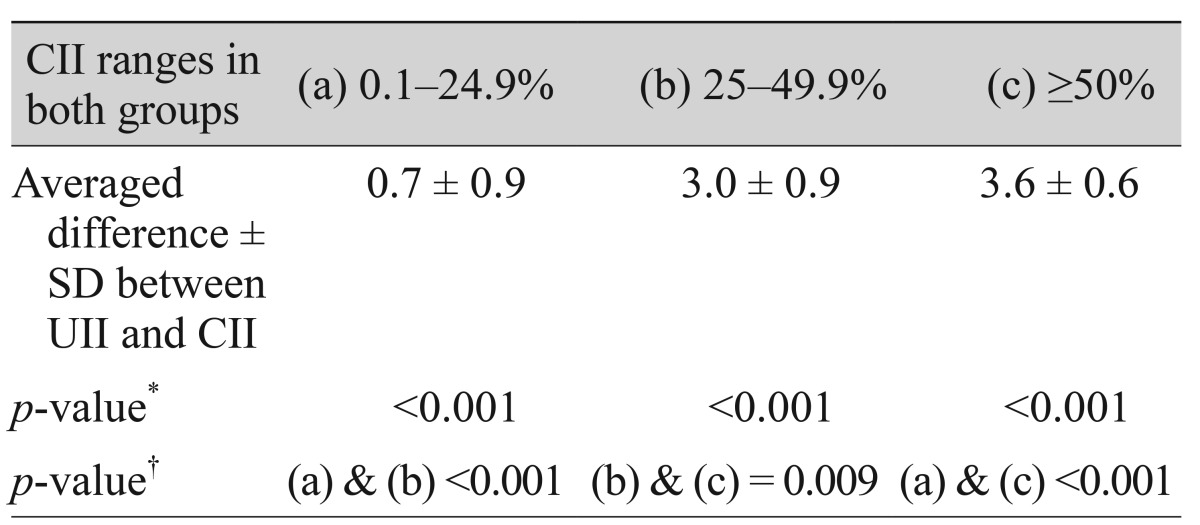
CII ranges (%) and the differences between UII and CII in both NPDR and PDR groups

Mean difference (%) of corrected ischemic index in each range (a) to (c). There was a statistically significant difference between each range.
Discussion
UWFA allows fine assessment of the retinal periphery, visualizing up to 200°, while 7SF images reveal only a 75° field of view. Measuring more extensive peripheral non-perfusion areas of the retina is important because capillary non-perfusion tends to enlarge from the site of origin, and anterior or peripheral locations are associated with more rapid progression of the nonperfused areas [6].
According to Spaide [7], wide-field imaging of the eye does not have a fixed, precise relationship with the imaging system and varying image deformations can be induced. Measurement of the ischemic index based on distorted UWFA images has limited several studies [1,2,8] and peripheral pathology is subsequently overrepresented. However, no simple method has been suggested to correct for this distortion.
In this retrospective study of eyes with DR, we demonstrated a simplified way of correcting the ischemic index evaluated by UWFA. To our knowledge, this is one of the first studies applying a CII to distorted peripheral retinal images in DR patients. Spaide [7] developed a method for imaging the fundus to determine perfusion of the retina in a study that examined central retinal vein occlusion treatment by standardizing the induced deformation of the posterior portion of the eye as a base image, with more peripheral regions warped to fit the reference base image using a thin-plate splines transformation. The warped images were then imported back into Photoshop to merge them into a montage. However, this method is computationally challenging and very time consuming. Our method, on the other hand, uses a simplified mathematical correction and, furthermore, we examined differences between UII and CII in relation to DR progression.
The present study demonstrated that patients with a CII of greater than 25% had a higher likelihood of DR progression (p < 0.001). This finding suggested that non-perfusion should be further stratified to better quantify retinal non-perfusion in DR. Even though the differences between UII and CII are not recorded as percentages, our results imply that differences between UII and CII increase with the ischemic index. Therefore, the ischemic index should be corrected in DR patients as it increases using UWFA. In analyzing neovascularization (NV), UWFA is capable of capturing 1.9 times more area of NV than 7SF; in addition, NV was located outside the 7SF area in 17% of diabetic patients [1]. Detecting a greater extent of ischemia in the peripheral retina would be beneficial for treating DR.
There are several limitations to the conclusions that can be drawn from this study. For instance, there currently is no gold standard for measuring ischemic index by UWFA, and our novel approach cannot be validated against any such standard. However, we attempted to introduce a novel, simplified model for correcting warping of widefield retina images compared to a previously reported rigorous approach. When grading UWFA, there are likely different sources of variability because of unquantifiable areas of ischemia due to eyelash artifacts and individual contrast adjustments. Thus, the reliability and reproducibility of UWFA interpretation is still being validated and should be carefully considered when interpreting our findings.
Oishi et al. [9] reported that the overall image by wide-field scanning ophthalmoscope is stretched horizontally to some extent. Therefore, our method of correcting distortions and ischemic index could have been more accurate than our current calculations show. The assumption that the retina is a complete sphere is another limitation of this study. The axial length of the human eye is variable and therefore, the slope of the tangent in every retinal location varied with axial length. However, finding the ischemic index of each axial length requires complicated and demanding work. We compared spherical equivalents and their range between NPDR and PDR groups, and there was no significant difference (p = 0.117) (Table 1). We did not include extremely high hyperopia or high myopia in the range (mean ± SD; 95% > -2.25 to +1.50 diopters for NPDR group, 97% > -2.38 to +1.50 diopters for PDR group).
There are subjective limitations to angiography interpretation, and the intra-examiner discrepancy in our study was 22%. In calculating ischemic indices, we included only the posterior half of the retina; therefore, peripheral ischemic regions might have been underestimated. With present widefield ophthalmoscope modalities, the anterior surface scanning of the retina needs to be validated. In addition, anterior vascular circulation of the retina is scant and the effect of the influence of anterior vasculature on retinal perfusion status is uncertain. For these reasons, the anterior surface of the retinal equator was not taken into account when measuring the ischemic index in this study. Further studies are needed to evaluate the importance of the anterior retinal vasculature. We have also chosen the median theta of each zone due to difficulties in measuring the exact angle; therefore, the ischemic area with an actual theta greater or lesser than the median would have been overestimated or underestimated within the error range.
Despite these limitations, this study shows the importance of correcting the ischemic index when evaluating peripheral ischemia in DR by UWFA. Randomized, prospective studies are recommended to confirm the findings of this study. Future studies are needed to determine the role that the distant peripheral and anterior retina plays in estimating the ischemic index.
Notes
This manuscript was presented as free paper in the 109th Annual Meeting of the Korean Ophthalmological Society on April 2013.
Conflict of Interest: No potential conflict of interest relevant to this article was reported.