Diabetic Retinopathy Risk Factors: Plasma Erythropoietin as a Risk Factor for Proliferative Diabetic Retinopathy
Article information
Abstract
Purpose
The purpose of this study was to evaluate whether any stage of diabetic retinopathy (DR) is associated with levels of plasma erythropoietin and other plasma parameters.
Methods
It was examined a representative sample of 180 type 2 diabetes patients aged 40 to 79 years. Ophthalmic examination including a funduscopic examination, performed by an experienced ophthalmologist and the retinal finding were classified according to the grading system for diabetic retinopathy of ETDRS (Early Treatment Diabetic Retinopathy Study). It was measured the levels of plasma erythropoietin, cholesterol, triglyceride, apolipoproteins A and B, C-reactive protein, fasting blood glucose and hemoglobin A1C (HbA1C) in 88 DR patients and 92 controls without DR. Risk factors correlated with DR were compared between groups.
Results
The study group of 180 patients included 72 males and 108 females. The mean age of the patients with and without DR was 57.36 ± 8.87 years and 55.33 ± 8.28 years, respectively. Of the 88 patients with DR, only 9 (10%) had proliferative DR and the rest suffered from non-proliferative DR. The mean plasma levels of erythropoietin in proliferative DR group showed a significant difference in comparison to other groups. The mean plasma levels of cholesterol, triglyceride, apolipoproteins A and B, C-reactive protein, and fasting blood glucose were not significantly different in the three groups except for HbA1C. The absolute relative risk (ARR) also showed that erythropoietin was an increasing risk for proliferative DR (ARR, 1.17; 95% confidence interval, 1.060 to 1.420; odds ratio,1.060).
Conclusions
Of the factors studied, erythropoietin level showed significant increase in proliferative DR group. The stepwise raised in mean plasma erythropoietin level which demonstrates significant correlation with proliferative DR versus remaining two groups, will be an indication of its role in proliferative DR.
Diabetes mellitus (DM) is the second leading cause of blindness and renal disease worldwide [1]. It is associated with micro vascular complications, such as diabetic retinopathy (DR) [2]. DR is a common complication of both type 1 and type 2 DM, with its prevalence increasing with the duration of diabetes and the patient's age. The systemic arteriosclerosis, anemia, renal impairment and pregnancy are other risk factors of DR [3]. The visual complication is devastating in people of working age in industrialized countries and affects the daily lives of millions of people. This visual complication was generally detected by fundus examination and despite tight control of glycemia, blood pressure and the lipid lowering therapy, number of DR patients keeps growing and therapeutic approaches are limited. There are significant limitations and side effects associated with the current therapies. Hence, there is a great need for development of new prevention strategies and treatment methods for DR.
There is evidence that specific level of cytokines change during development of DR, prior to clinical manifestation [4]. Several growth factors also play a role in the different phases of proliferative diabetic retinopathy (PDR). The pro-angiogenic cytokine and vascular endothelial growth factor (VEGF) are considered to be the primary factors involved in neovascularization of PDR. Another possible causal factor of fibrosis in PDR is the connective tissue growth factor, a family of matricellular proteins, which is a cytokine with profibrotic activity. These are associated with fibrosis in vitreoretinal disorders and DR [5]. Diskin et al. [6] concluded that the prevalence and severity of PDR appeared to be associated most closely with erythropoietin (EPO) administration and levels. The correlation between traditional known risk factors such as diabetes duration, age, and serum cholesterol level, remains unclear in development of DR. Deterioration of retinopathy after initiation of hemodialysis suggests an association with hematocrit, most significantly with the total dose of EPO administration. Another study evidently suggests that EPO is a potent retinal angiogenic factor, acting independent of VEGF and has the capability of stimulating ischemia-induced retinal angiogenesis in PDR. This study concluded that inhibition of these molecular mechanisms in retinal angiogenesis could represent a new therapeutic strategy for halting or preventing pathological angiogenesis in DR [7].
Izuora et al. [8] found that hemoglobin A1C (HbA1C) was not associated with DR. Regarding their study of inflammatory markers (HbA1C, C-reactive protein [CRP], interleukin-6, prostaglandin E1, and prostaglandin E2), prostaglandin E2 was the only marker that had significant increases in patients with DR compared with control subjects. Although numerous studies have attempted to identify the target risk factors for DR, currently there is no established method for preventing the disease. While triglycerides, apolipoproteins A (apo A) and B (apo B) are involved in the progression of DR [9] but there are reports indicative of an unsupported relationship between serum lipids and DR [10,11]. Thus, this study attempted to find any kind of relationship between DR and plasma parameters as risk factors.
Materials and Methods
This cross-sectional study was conducted at Valiaser Hospital health center, a specialized secondary referral center. A total of 180 patients with type 2 DM, aged 40 to 79 years who were referred to the Ophthalmology Clinic for screening of DR were included in the study. A fasting blood sugar (FBS) level ≥126 mg/dL or self-reported uses of diabetic medication were the diagnostic criteria for type 2 DM. All participants signed the informed consent, and the gender related information of the patients was recorded in a sheet. Exclusion criteria for the study included severe hypertension, smoking, pregnancy, hepatic failure, heart failure, goiter, anemia (hemoglobin <12 g/dL), nephropathy (creatinine ≥120 mol/L) and acute systemic infection.
All of participants underwent an ophthalmic examination by an experienced ophthalmologist. This examination consisted of funduscopy by slit-lamp with 90 D lenses and indirect ophthalmoscopy. Fluorescein angiography was also performed due to diagnostic decisions and therapeutic purposes as required. DR was defined as the presence of one or more of the following lesions: microaneurysms, blot or flame-shaped hemorrhages, hard exudates, cotton-wool spots, or evidence of laser treatment for DR at baseline. DR was categorized as non-proliferative (NPDR) and proliferative (PDR), determined by assessment of retinal neovascularization presence. A venous blood sample was collected after a 12-hour overnight fasting period to estimate levels of EPO, HbA1C, FBS, CRP, and lipid profiles in apo A and apo B. The FBS levels were measured using the glucose oxidase method. HbA1C was determined by high-performance liquid chromatography and CRP levels were evaluated with a Pars Azmoon kit (Pars Azmoon, Tehran, Iran) and the autoanlayzer approach. The levels of total-cholesterol and High-density lipoprotein cholesterol, triglyceride, and apo A and apo B were measured by enzymatic methods. Low-density lipoprotein cholesterol level was calculated using the Friedewald equation. The EPO levels were measured using a EPO-ELISA test kit obtained from BioMerieux (France).
The distribution of data was normal by Kolomogorov Smirnov-Z test. The variables were analyzed by independent t-test, one-way analysis of variance and Tukey's post-hoc test. Logistic regression was used to determine the various risk factors associated with the presence of DR. A p-value of <0.05 was considered statistically significant. The statistical analyses were performed using the SPSS ver. 15 (SPSS Inc., Chicago, IL, USA).
Results
Of the 180 patients with type 2 DM, 92 (51.1%) did not have DR. The remaining 88 (48.9%) patients had evidence of DR, 79 (43.9%) of whom had NPDR and 9 (5.00%) had PDR. The mean age of the patients with and without DR was 57.36 ± 8.87 and 55.33 ± 8.28 years old respectively. This difference in age was not statistically significant (p = 0.113).
No significant differences in mean FBS, lipid profiles, or apoA and apoB levels were observed between the three groups. The mean HbA1C in the two retinopathy groups (9.16 ± 2.17%) was significantly higher (p = 0.05) than in the patients without DR (8.56 ± 1.90%). In the group without DR, 19.60% had an increased CRP level compared with 17.00% in the pooled of two DR groups. This difference was not statistically significant (p = 0.66).
A significant difference was observed in mean EPO level among the three groups, with the Tukey's post-hoc test demonstrating that mean EPO levels were significantly higher in patients with PDR (p = 0.007) relative to no retinopathy. The mean EPO ratio were also higher in the PDR group (p = 0.019) relative to the NPDR group. But when the NPDR group was compared with those without DR (p = 0.58), the difference was not significant (Table 1).
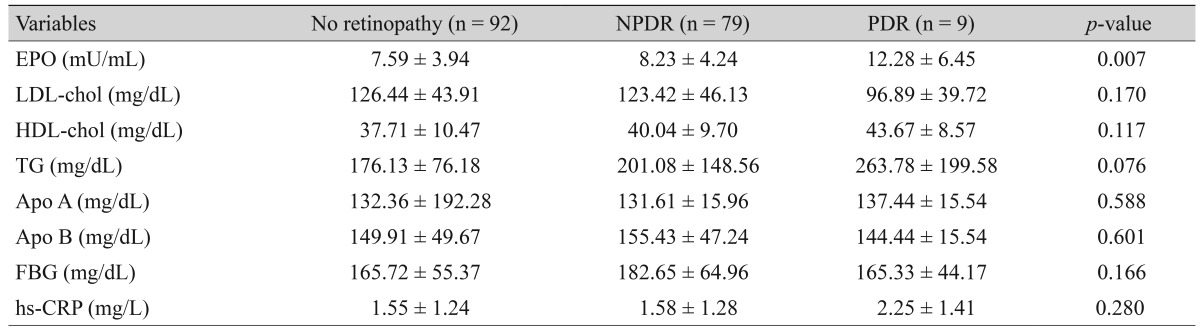
Plasma levels of EPO, HDL- and LDL-chol, TG, Apo A and B, hs-CRP, and FBG in the three study groups
To identify risk factors for DR, the patients were classified into two groups: with or without retinopathy. Logistic regression analysis for DR as the dependent variable and HbA1C, EPO, cholesterol, triglyceride, apoA and apoB, CRP, and FBS levels as independent variables showed that EPO levels were significantly associated with the presence of only PDR group. The absolute relative risk (ARR) also revealed the increasing risk (ARR, 1.170; 95% confidence interval, 1.060 to 1.420; odds ratio, 1.17) of PDR but not with all groups of retinopathy patient (Table 2).
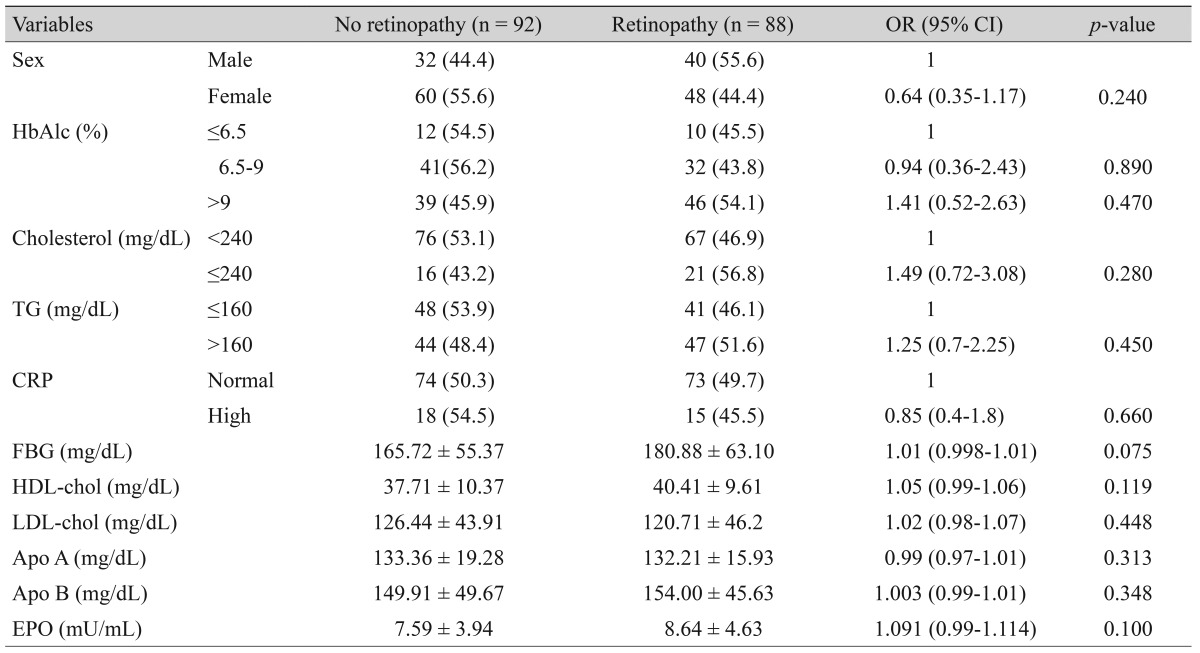
Results of the logistic regression analysis with diabetic retinopathy as the dependent variable in patients with type 2 diabetes mellitus
Discussion
This study revealed a significant association between HbA1C level and the presence of DR; furthermore, HbA1C level was an independent risk factor for the development of DR in patients with type 2 diabetes mellitus. Several other studies have been conducted to identify risk factors for the development of incipient and overt DR, in which poor glycemic control, urinary albumin excretion, the duration of diabetes, abnormal HbA1C levels, hypertension, and high serum creatinine levels predicted its onset [12,13,14,15,16,17].
Jee et al. [18] evaluated risk factors of DR and vision threatening complications including age, sex, diabetes duration, HbA1C, hypertension, lipid profiles, and refractive error. In their study, DR was associated with a longer duration of diabetes, poor glycemic control, and higher systemic blood pressure. In this study, HbA1C concentration was evaluated as a risk factor for the development of incipient or overt DR. While we observed a correlation between EPO and certain DR stages, such correlation could not be found in all stages as reported by other studies [19,20].
Wang et al. [19] proposed that EPO may have a protective effect in pericytes, although this possibility was not investigated. They hypothesized that because of its protective role in retinal pericytes, EPO may have potential as a novel therapeutic agent for the treatment of early DR. The survey conducted by Watanabe et al. [20] the median vitreous EPO levels in patients with PDR were significantly higher than those levels in non diabetic patients. EPO was associated more strongly with PDR than VEGF and there was not any significant correlation between the vitreous and plasma levels of EPO in their study. They concluded that increased EPO levels in the vitreous fluid were probably due to increased local production in the retina but the higher plasma EPO ratios in PDR patients in our study was not compatible with these earlier reports [19,20]. This incompatibility indicates a need for more studies to examine the role of plasma EPO and intravitreal EPO ratio in DR. Mitsuhashi et al. [21] reported that intravitreal injection of EPO in diabetic rats might have played a primary role against the progression of DR via reducing blood vessel degeneration at a very early stage of the disease. So, they concluded that it could be promising to find a new management of DR.
The other studies performed on plasma EPO and DR are limited and controversial, as they have focused on other retinal diseases, utilized animals, or only measured intravitreal EPO ratio [7,22,23,24]. These other studies do not adequately describe the role of plasma EPO in DR [7,20].
It is important to note that the findings of this study were obtained from a study group with different clinical characteristics. Firstly, the majority of patients did not have PDR, and secondly, plasma EPO levels were measured, but not vitreous fluid EPO levels. Although it was showed EPO levels were significantly higher in patients with PDR, this increase may also have been caused by cell proliferation.
This study is a unique because it compared measurements of plasma parameters, in various stages of the disease, among both DR patients and non retinopathy diabetes patients. According to our findings, the correction of plasma EPO levels in PDR patients can reduce the risk of PDR to 1.17%.
The conflicting theories exist on the development of DR, and the well-established preventive measure of strict glycemic control is not completely effective for preventing DR-approximately 12% of intensively-treated diabetic patients still develop DR. Strict glycemic control places great demands on both patients and health care systems, making it a questionable approach [25], although some studies have claimed an increasing trend towards prevention of DR by improved glycemic control [10,15,26].
While the available evidence indicates that inflammation contributes to the development and progression of DR, this study showed no association between CRP and DR. There is also evidence indicating that anti-inflammatory treatment with intravitreal glucocorticoids and anti-VEGF therapy reduces the overall severity of both DR and macular edema, and restores the blood-retina barrier. However, further investigations are needed to develop therapies that control inflammation in DR [27]. More importantly the association of CRP and DR, especially in clinically significant DR stage, has been the source of ongoing debates in the medical literature [28].
There are many important factors and socioeconomic conditions which are obstacles to intensive control of known diabetic risk factors. Therapy should be simple and effective at improving risk factors to safe levels for patients. Although the majority of patients are aware of the benefits of good glycemic control, achieving this level of control is difficult and requires a significant effort by the patients and their primary-care physicians. This extra effort is an important and further research on many hypothetical factors such as inflammatory marker is essential in order to find a simple and safe practical approach for prevention of DR.
Notes
No potential conflict of interest relevant to this article was reported.