The Correlation of Routine Tear Function Tests and Conjunctival Impression Cytology in Dry Eye Syndrome
Article information
Abstract
Purpose
To establish the strength of the association between routine tear function tests and conjunctival impression cytology (CIC) and to determine whether they simulate the morphological and cytological changes that occur on the ocular surface in dry eye. What are the sensitivity, specificity and positive predictive values of these tests when CIC is considered the gold standard?
Methods
The tear film profile included tear film break up time (TBUT), Schirmer's-1, Rose Bengal scores (RBS), and impression cytology. CIC samples were obtained from the inferior bulbar conjunctiva and stained with periodic acid-Schiff and counter stained with hematoxylin and eosin.
Results
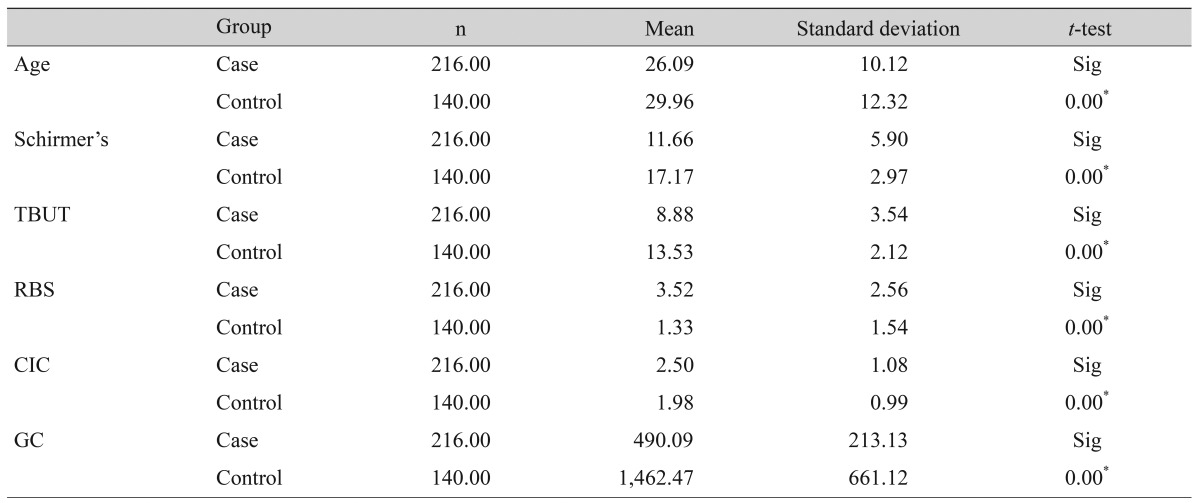
The mean Schirmer's value was 11.66 ± 5.90 in patients and 17.17 ± 2.97 in controls (p < 0.001). The mean TBUT in participants was 8.88 ± 3.54 and 13.53 ± 2.12 in controls (p < 0.001). Patients had a mean goblet cell density (GCD) of 490 ± 213, while the value for controls was 1,462 ± 661 (p < 0.001). Abnormal CIC was observed in 46.7% cases of dry eye and in 32.8% of controls. The correlation coefficient (L) for Schirmer's was 0.2 and 0.24 for participants and controls, respectively, while TBUT values were 0.26 and 0.38, RBS were 0.5 and 0.5, and GCD was 0.8 and 0.6 in cases and controls, respectively.
Conclusions
GCD, RBS, and TBUT were better predictors of morphological and cytological changes in the conjunctiva than Schirmer's in dry eye syndrome. The sensitivity of tear function tests in diagnosing dry eye was TBUT > Schirmer's > RBS, and the specificity was Schirmer's > TBUT > RBS in decreasing order when CIC was considered the gold standard.
According to the International Dry Eye Workshop, dry eye syndrome is a multifactorial disease of tears and the ocular surface. It results in symptoms of discomfort, visual disturbances and tear-film instability with potential damage to the ocular surface. It is accompanied by increased osmolarity of the tear film and inflammation of the ocular surface [1].
The clinical diagnosis and management of dry eye has been a challenging task for ophthalmologists due to the lack of a universally accepted gold standard test. As a result, there has been a drift towards symptom-based assessment as a key diagnostic component. The most commonly used measure of tear production is the Schirmer's test. However, it is unrepeatable (due to reflex tearing) and overlooks the evaporative aspects of dry eye. While Schirmer's test without anesthesia can be considered a valid option for severe dry eyes, it lacks sensitivity [2]. In contrast, tear film break up time (TBUT) can be used to assess tear film stability. This test seems to be more reliable than Schirmer's as it is somewhat repeatable [3,4].
Staining with vital dyes like Rose Bengal measures the extent of damage to the ocular surface, but this method may not detect mild cases. However, it can also be used in combination with other tests like TBUT in dry eye states [5]. Conjunctival excision biopsy can be used for the histopathological diagnosis of dry eye. However, this procedure is invasive and therefore may not be accepted by patients. In clinical practice, not all centers may be equipped to perform the biopsy [6].
Conjunctival impression cytology (CIC) involves removing one to three cell layers of the surface epithelium while preserving the morphology. It is minimally invasive, relatively easy to perform and yields reliable information about the area sampled with minimal discomfort to the patient [7, 8, 9, 10]. However, it has not yet become the first-line investigation in dry eye syndrome. Currently, these tests are often used in combination to diagnose and grade dry eye severity.
The purpose of the present study was to establish the strength of the association between CIC and other tear function tests in patients with dry eye syndrome due to various etiologies and normal individuals. The study also aimed to ascertain whether these tests accurately predict cytological and morphological changes in the conjunctiva in tandem with that seen on impression cytology.
Materials and Methods
A case control study was conducted in a medical college hospital from February 2010 to June 2011. Patients were enrolled on the basis of a questionnaire that assessed the presence of common symptoms of dry eye [11]. A symptomatic score of 0 to 6 was mild, 6.1 to 12 was moderate, and 12.1 to 18 indicated severe dry eye (Table 1). One hundred and forty eyes of age- and sex-matched controls without symptoms of dry eye were also selected from the same population.

Dry eye questionnaire and scoring system
Patients between 10 to 60 years of age with typical symptoms of dry eye syndrome participated in the study (Table 1). Patients having current ocular infection, past history of herpetic eye disease, liver disease, diabetes and laser in situ keratomileusis were excluded from the study. Pregnant and lactating mothers, post-menopausal women, cognitive or psychiatric disorders, human immunodeficiency virus and hepatitis B or C infection, current use of punctual plugs, anti-glaucoma drugs, oral anti-coagulants, topical corticosteroids (four to six weeks prior to study enrollment) and anti-cholinergics were also excluded. Patients allergic to fluorescein and malignancy or chronic infection of lacrimal gland were also excluded.
Written informed consent was obtained from all patients willing to take part in the case control study base on Helsinki protocol. The trial was approved by the ethics committee at our institution. A single examiner performed all the tear function tests and was blinded to the information obtained from the dry eye questionnaire.
The TBUT was measured first using a cobalt blue filter on slit-lamp examination. A sterile fluorescein strip containing 1 mg fluorescein sodium was applied on the inferior bulbar conjunctiva (Madhu Instruments, Delhi, India). The strip was moistened with normal saline solution prior to application. The interval between a complete blink and the appearance of the first dry spot was noted. Two measurements were taken in succession and averaged [12].
The participant then waited for 30 minutes, and Schirmer's test with anesthesia was performed with the eyes closed by placing the test strip over the inferior lid margin towards the lateral canthus. After waiting for another 30 minutes, the Rose Bengal test was performed by applying a moistened sterile strip containing 1.5 mg Rose Bengal over the inferior bulbar conjunctiva. A van Bjisterveld score of 4 or more was considered positive for dry eye syndrome [13].
CIC specimens were obtained from the inferior bulbar conjunctiva using a circular 0.21-micron Millipore cellulose acetate filter paper patch 13 mm in diameter (Sartorius, Goettingen, Germany). The eye was anesthetized using one drop of 4% Xylocaine. The lacrimal lake at the inner canthus was dried with a cotton tip applicator. The filter paper was grasped with a blunt smooth edge forceps and applied to the inferior bulbar conjunctiva. The filter paper was gently pressed with a glass rod held in the other hand. After 4 to 10 seconds, the paper strip was removed in a peeling fashion, and the specimen was transferred to the lab for staining and fixation. The filter paper was placed on a glass slide with albumin paste for the specimen transfer. The slide was labeled and numbered, and then it was stained with periodic acid-Schiff and counter stained with hematoxylin and eosin. The mounted slide was examined under the microscope with a 10x high-power field (HPF). After localization, the cells were then analyzed with 40x HPF magnification. At least 10 HPF were examined for goblet cells and epithelial cells. Grading and scoring was carried out using the criteria suggested by Nelson [14] grades 0 and 1 were regarded as normal, whereas grades 2 and 3 were considered to represent abnormal cytology.
The means of the two groups were compared with a t-test. The Pearson chi-square test was used for proportions. The p-value was calculated at the 1% and 5% levels. A p-value <0.001 at the 1% level and <0.005 at the 5% level implied that the comparison was statistically significant. Correlation analysis was done using a t-test. A coefficient of linear expression (L) 0.5 or more was considered a significant association. Sensitivity, specificity and positive predictive values of tear function tests were calculated using CIC as the gold standard.
Results
After the poorly stained slides were discarded (n = 23), this study included 216 valid cases (eyes) and 140 controls. The mean age of cases was 26.09 years, and the standard deviation was 10.12. The mean age of controls was 29.98 years with a standard deviation of 12.47. There was a slight preponderance of males in our study in both the groups. However, the difference between males and females was not statistically significant (p = 0.817). The mean Schirmer's values were 11.66 ± 5.90 in cases and 17.17 ± 2.97 in controls (Table 2). On application of the t-test, the difference was statistically significant (p < 0.001). The mean TBUT was 8.88 ± 3.54 in patients and 13.53 ± 2.12 in controls.
Mean test values
The mean GCD in cases was 490 ± 213 and 1462 ± 661 in controls (p < 0.001). On t-test, the difference was statistically significant (p < 0.001). Likewise, the mean Rose Bengal score (RBS) was 3.52 ± 2.56 in patients and 1.33 ± 1.54 in controls (Table 1). The difference was statistically significant (p < 0.001) for the t-test.
Test values were compared in cases and controls and cross tabulated with CIC. The chi-square test was done for statistical analysis (Tables 3,4,5). We found that 46% cases of dry eye had abnormal cytological changes (Nelson grade II-III), whereas this type of cytology was observed in only 32.8% of controls. However, normal goblet cell density (GCD, >500 cells/mm2) was seen in only 21.3% cases; 78.7% cases had abnormal goblet cell counts (p < 0.001).

Schirmer's test scores and cross tabulation

TBUT and conjunctival impression cytology cross tabulation
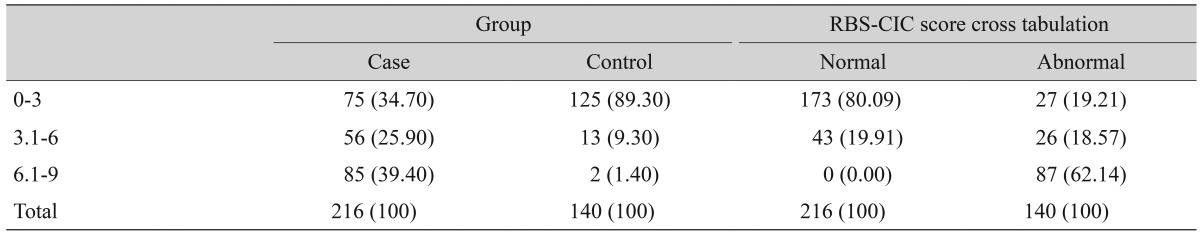
RBS profile and CIC cross tabulatio
Correlation analysis was done for CIC and Schirmer's test value in cases and controls (Fig. 1A). The Schirmer's test values did not correlate well with impression cytology in the experimental group, but they did somewhat amongst controls. In contrast, TBUT values correlated well with the CIC score in cases and more so amongst controls (Fig. 1B). Correlation analysis was also carried out for CIC and RBS scores. The RBS score correlated well in both groups (Fig. 1C). On correlation analysis of GCD with impression cytology scores, there was a stronger correlation in cases as compared to controls (Fig. 1D). Fig. 1E and 1F show periodic acid-Schiff stained impression cytology specimens with mild and severe dry eye respectively.
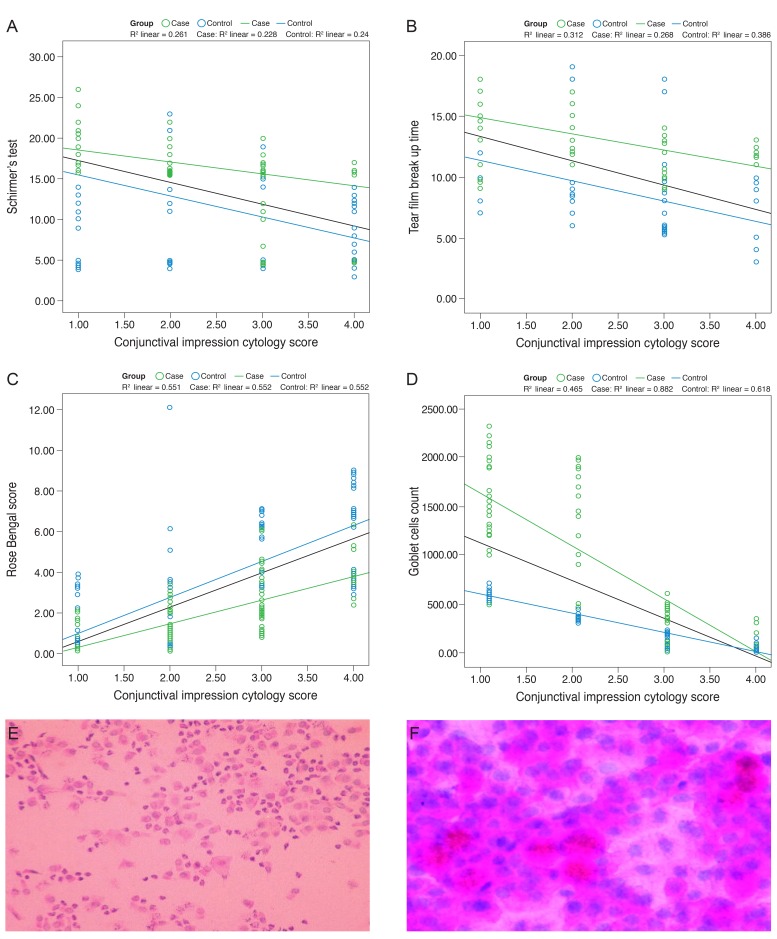
(A) Scatter diagram showing correlation between Schirmer's test and conjunctival impression cytology. (B) Scatter diagram showing correlation between tear film break up time and conjunctival impression cytology. (C) Scatter diagram showing correlation between Rose Bengal score and conjunctival impression cytology. (D) Scatter diagram showing correlation between goblet cell density and conjunctival impression cytology. (E) Periodic acid-Schiff stained impression cytology specimen with mild dry eye and a reduced goblet cell count. (F) Periodic acid-Schiff stained image with squamous metaplasia, inflammatory infiltration and a decrease in goblet cells.
The sensitivity, specificity and positive predictive value (PPV) of Schirmer's, TBUT and Rose Bengal staining were calculated taking CIC as the gold standard (Table 3). The sensitivity of Schirmer's was 65.69%, and the specificity was 68.50% with a PPV of 45.58%. The sensitivity of TBUT was 80.43%, and it had a specificity of 64.96% with a PPV of 45.40%. The sensitivity of RBS was 63.73% with a specificity of 64.17% and a PPV of 41.67%.
Discussion
The term 'dry eye' includes a wide spectrum of alterations of the ocular surface with different etiology and pathophysiology. There is no universally acceptable consensus on the guidelines of a diagnosis of dry eyes due to a lack of well-defined cut-off values. A generally agreed gold standard still does not exist. Most diagnostic tests like Schirmer's are still poorly standardized, making comparisons between different studies tenuous at best [15]. Thus, there has been a shift towards symptom-based assessment as a key component of clinical diagnosis [16,17,18].
CIC is non-invasive, relatively easy to perform and yields reliable information about the sampled area. At the same time, CIC is a time-consuming procedure and may cause irritation and discomfort in some patients. Moreover, there may be variability in goblet cell counts in samples obtained from exposed and non-exposed regions of the conjunctiva. Major ophthalmic centers can, however, develop and introduce this technique into routine clinical practice. This strategy is best achieved with a team approach that includes the ophthalmologist, pathologist, microbiologist, and immunologist.
In the present study, tear function tests were pitted against CIC to determine whether they occur alongside the cytological changes on the ocular surface in dry eye syndrome. A limitation of this study was that the mean age of controls was higher than that of the patient group (Table 2). The aim was to match the ages of cases and controls. Since our study had an adequate sample size (n = 216), the difficulty was that it required a substantially large population of potential controls from which to draw and also to allow for adjustment of other non-matched variables like ethnicity and patient background (rural or urban), in people who were willing to participate in the study. However, the difference is likely to have a marginal variation in the standard error of difference between the means.
GCD was significantly reduced in dry eye cases as compared to controls. There was a strong correlation between CIC score and GCD (L = 0.8 and 0.6, respectively). This result was similar to a study conducted by Murube and Rivas [19] and Reddy et al. [20]. Bandyopadhyay et al. [21] investigated the cytological changes that occur in ocular surface disorders and found a statistically significant difference in cytology scores between cases and control groups, which was also similar to the present study.
In dry eye patients, 16.8% patients with Schirmer's results of less than 10 mm in 5 minutes had normal cytology and 45.6% had abnormal cytology (p < 0.001) whereas only 5.6% of controls with abnormal cytology had abnormal Schirmer's (L = 0.2). Thus, it appears that Schirmer's does not predict any morphological changes in the conjunctiva.
Although there has been some consensus on the correlation between the assessment of the ocular surface by CIC and conjunctival biopsy, Sood et al. [22] demonstrated a strong correlation between assessments made by tear function tests like Schirmer's and CIC results. However, the findings of our study were different from theirs, which was probably due to the different staging method (Tseng [23]) used by Sood et al. [22] for grading CIC.
TBUT values correlated well with CIC scores in both patients and controls on linear regression analysis; 31.6% patients with dry eye and TBUT less than 10 seconds had a normal cytology and 72.8% exhibited abnormal cytology (p < 0.001). In contrast, 28% of the control group had an abnormal cytology (L = 0.28 and 0.38, respectively). TBUT is therefore a better predictor of morphological and cytological changes at the conjunctiva than Schirmer's.
Paschides et al. [24] also found a similar correlation using a simple linear regression analysis to compare the results. These authors reported that 24.1% patients with dry eye had a normal RBS score and 20.6% had normal cytology. It was found that 65.3% had an abnormal RBS score, and 76.9% had abnormal cytology. On simple linear regression analysis, RBS scores correlated well with CIC scores in both groups (L = 0.5). Thus, RBS does predict morphological changes in the conjunctiva of dry eye patients (p < 0.001). This result was in sharp contrast to the results of a study done by Yaylali and Ozyurt [25]. The probable explanation for this difference was that Yaylali and Ozyurt established a correlation between the tear film profile and CIC for specific causes of dry eye in a small sample size. The present study compared the tear film profile and CIC in various etiologies of dry eye syndrome. The larger sample size in our study could explain the difference in results.
Doughty [26] studied GCD of normal human participants from impression cytology specimens. They found a wide variability in GCD in samples obtained from exposed (427 ± 376 cells/mm2) and non-exposed (973 ± 789 cells/mm2) locations. The authors suggested that environment related factors seem to have an overwhelming influence on the ocular surface, so there was variability in GCD in samples obtained between exposed and non-exposed quadrants of the conjunctiva. In another study, Doughty [27] reported that the use of a small sampling area (high power field of view) is likely to result in an unacceptably large uncertainty (variability) in the GCD estimates.
In the present study, we initially examined mounted slides on a 10x HPF. At least 10 HPFs were counted for goblet and epithelial cells to reduce the degree of variation. After localization, cells were then examined at 40x HPF magnification. However, in dry eye states, less variability is expected in samples obtained from different locations as compared to normal human participants.
Whether CIC can be used as a first-line investigation for dry eye diagnosis could not be determined. The design of the present study allowed for this comparison. However, we calculated the sensitivity and specificity of various tear function tests in this study. The sensitivity and specificity of Schirmer's reported by Gupta et al. [28] was 81.3% and 74.9%, respectively. These results were comparable to the sensitivity and specificity estimated in our study (80.43 and 64.96). Additionally, Rahman et al. [29] reported that the specificity of TBUT was 75.57% and the sensitivity of Rose Bengal was 92.85%. This result was different from our study because their gold standard test was the Schirmer's test, as opposed to CIC in our study. The accuracy of tear function tests in predicting morphological and cytological changes in the conjunctiva was GCD > RBS > TBUT > Schirmer's. In decreasing order, the sensitivity of tear function tests in diagnosing dry eye was TBUT > Schirmer's > RBS, and the specificity was Schirmer's > TBUT > RBS. CIC was considered to be the gold standard.
Notes
No potential conflict of interest relevant to this article was reported.