


Hyperbaric oxygen therapy (HBOT) is effective and noninvasive treatment that has been applied to treat various conditions related to hypoxia, including decompression sickness, acute carbonmonoxide intoxication, air embolism, soft tissue infections, radiation necrosis, and impaired wound healing [1].
HBOT increases oxygen pressure and concentration of reactive oxygen species (ROS) in tissue [2]. An excess of ROS in tissues and/or deficiencies in antioxidant activity, may contribute to complications of HBOT [3,4]. The eye, with its intense exposure to light, robust metabolic activity and in certain regions, high oxygen tension, is particularly susceptible to oxidative damage. Reactive oxygen and nitrogen species have been implicated in a growing number of medical conditions affecting the human eye. For example, ROS and deficiencies in antioxidant activities contribute to the pathogenetic processes in cataract, age-related macular degeneration and keratoconus [5-8].
ROS can play a role in the pathogenesis of glaucoma by stimulating apoptosis and inflammatory pathways on the level of the trabecular meshwork (TM) [9]. The exact molecular impact of ROS on the TM is uncertain, although small studies have suggested reduced cellular adhesion to the surrounding extracellular matrix, overexpression of extracellular matrix proteins such as fibronectin leading to reduced TM-cell permeability and direct damage as key mechanisms [10-12].
Our aim to evaluate the effect of HBOT on central corneal thickness (CCT), intraocular pressure (IOP), and retinal nerve fiber layer (RNFL) thickness in patients with type 2 diabetes mellitus (DM).
Materials and Methods
This prospective, nonrandomized-cohort study was conducted at Department of Retina, University of Health Sciences between June 2018 and June 2019. Ethical approval was obtained from the Local Research Ethics Committee (project no. 2017.12.1.04.020), and the study performed according to the tenets of the Declaration of Helsinki. The nature and purpose of the study were explained in detail to all participants, and written informed consent was obtained.
Forty-six eyes of 46 consecutive patients with a diagnosis of diabetic foot ulcer (DFU) and planned to 30 sessions HBOT were included in this study. ParticipantŌĆÖs right eyes were evaluated. Patients who undergoing argon laser photocoagulation, ocular surgery and antivascular endothelial growth factor therapy in less than 1 years, have uncontrolled systemic or ocular diseases, consuming alcohol and tobacco, refractive error beyond ŌłÆ2.0 and +2.0 diopters, corneal diseases, signs or history of glaucoma or ocular hypertension, neovascularization or edema on optic disc, optic disc anomalies and noncompliant patients were also excluded the study.
HBOT procedure
HBOT was carried out in a multiplace hyperbaric chamber once a day (between 8:30 a.m. and 10:00 a.m.), five times a week. The treatment protocol consisted of 120 minutes lasting periods of inhalation of 100% oxygen at a pressure of 2.5 atmospheres absolute, interspersed with two ŌĆ£air breaksŌĆØ lasting 5 minutes, after each 30 minutes of inhalation. All of the patients underwent 30 sessions of HBOT.
Ophthalmological evaluation
Demographic data from those involved in the study were obtained baseline and a complete ophthalmologic examination including assessment of best-corrected visual acuity, measurement of IOP, slit lamp biomicroscopy and dilated fundus examination were performed. Fundus florecein angiography (FFA) imaging and anterior chamber angle examination with the Goldman three-mirror contact lens were done all patients at baseline and after three months of last session of HBOT.
CCT was measured by the same ophthalmologist using Lenstar LS 900 (Haag-Streit AG, K├Čniz, Switzerland). After instillation of a mixture of 0.5% proparacaine and fluorescein into the eye, IOP was measured by Goldmann applanation tonometry and the average of three measurements was recorded. IOP measurements of the patients were made between 10:00 a.m. and 10:30 a.m. during the study. Peripapillary RNFL thickness was measured by automatically using a spectral-domain optical coherence tomography device (Spectralis; Heidelberg Engineering, Heidelberg, Germany). All of the spectral-domain optical coherence tomography images had a signal strength of 9 or better. For RNFL analysis, a 3.45-mm diameter peripapillary ring was measured as six quadrants containing nasal-superior (NS), temporal-superior (TS), nasal-inferior (NI), temporal-inferior (TI), nasal (N) and temporal (T). All measurements were obtained at baseline (CCT-b, IOP-b, and RNFL-b), after 10th session of HBOT (CCT-1, IOP-1, and RNLF-1), after 20th session of HBOT (CCT-2, IOP-2, and RNLF-2), after 30th session of HBOT (CCT-3, IOP-3, and RNLF-3) and after 3 months last session of HBOT (CCT-4, IOP-4, and RNLF-4). Hemoglobin A1c (HbA1c) (%) values were gained before of HBOT.
Statistical analysis
Statistical analysis of the study was done by using IBM SPSS Statistics ver. 19.0 (IBM Corp., Armonk, NY, USA). The distribution of data was determined with a Shapiro-Wilk test. The descriptive statistics of continuous variables were expressed as mean ┬▒ standard deviation and categorical variables were expressed as frequency and percent. FriedmanŌĆÖs ANOVA test was used for the comparison of variables of measurements at different times. Paired Samples t-test or Wilcoxon sign rank test were used to compare baseline and each measured value of different times according to the distribution of data. Kruskal-Wallis test was used to compare groups created according to HbA1c values. A p-value of less than 0.05 was considered statistically significant in all test except for FriedmanŌĆÖs ANOVA test (p < 0.01 was considered statistically significant).
Results
This study included 46 eyes of 46 type 2 diabeticpatients who have DFUs. Thirty-three patients were male and 13 patients were female. The median age was 58.58 ┬▒ 3.30 years (range, 53-65 years) and duration of diabetes was 20.52 ┬▒ 2.84 years (range, 16-27 years). The mean visual acuity during study period was 0.22 ┬▒ 0.13 logMAR (between 0.3 and 0.0 logMAR). All patients were phakic. The average cup-to-disc ratio in the study subjects was between 0.1 and 0.3 and absence of glaucomatous disc appearance. According to the baseline FFA findings, 17 eyes have mild-moderate non-proliferative DRP, 11 eyes have severe non-proliferative diabetic retinopathy (DRP) and 18 eyes have no proliferative diabetic retinopathy findings due to applied laser photocoagulation at least 1 years ago.
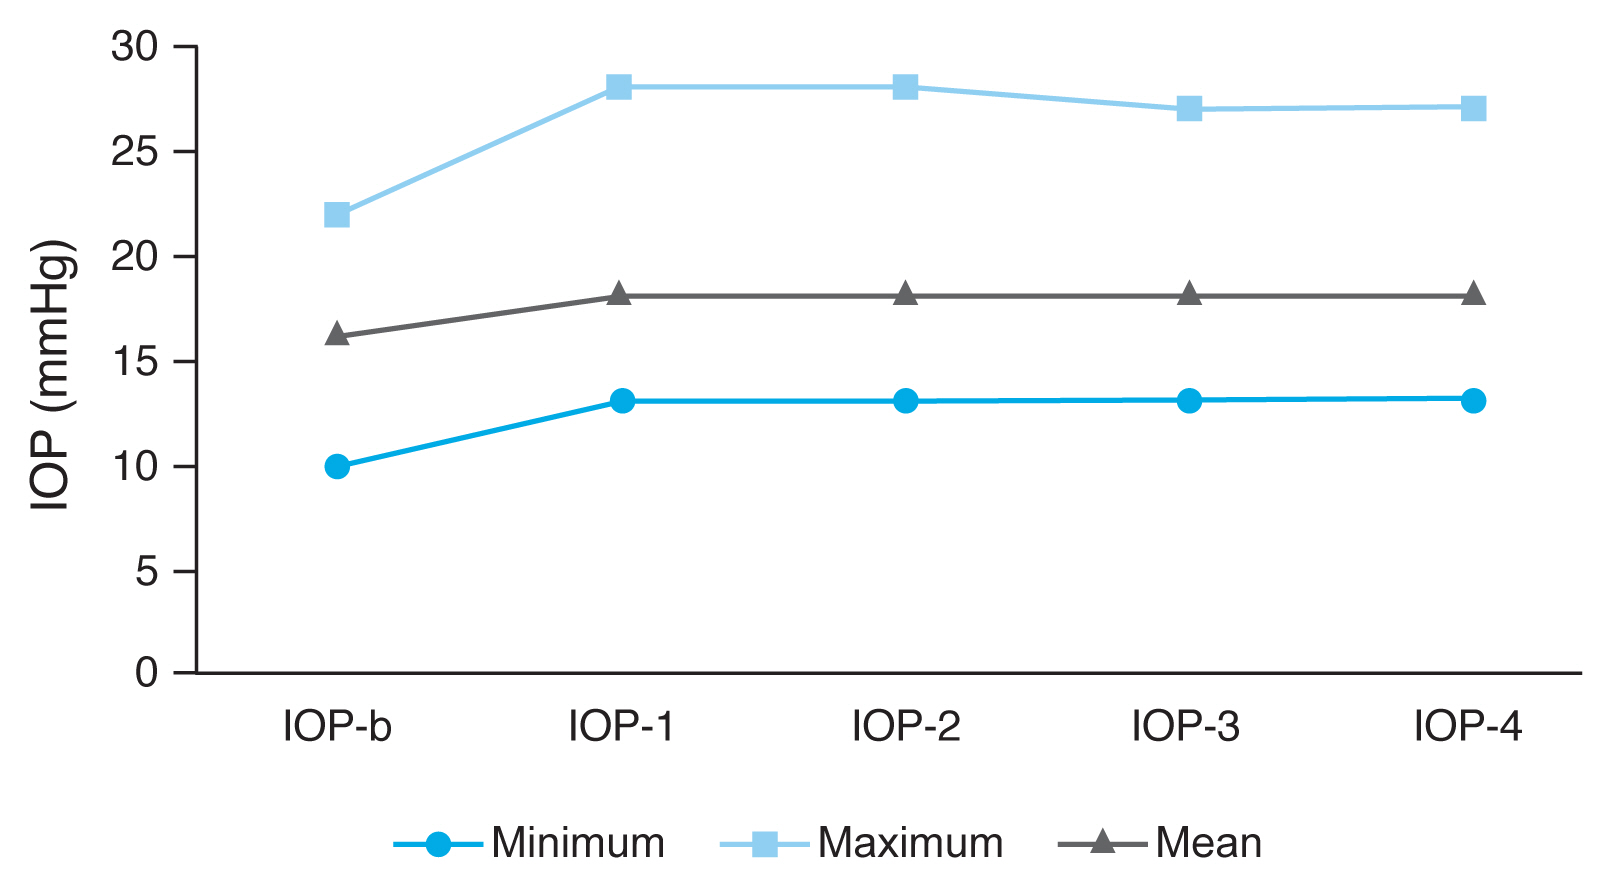
There was significant IOP increases in all measurement times compared to the base-line values (p < 0.05) (Table 1 and Fig. 1). During the study period, the IOP level increased over 21 mmHg (between 22 and 28 mmHg) in seven eyes (15.2%). These cases were closely followed by whether they had visual field defects with standard automated perimetry 24-2 testing (Humphrey Field Analyzer; Carl Zeiss Meditec, Dublin, CA, USA) once a week until the end of the study. In none of these cases, glaucoma-related visual field defects were observed. These patients no underwent topical antiglaucomatous medication until the end of HBOT. Topical brimonidine tartrate 0.15%, 2 ├Ś 1 was applied into these seven eyes after the last HBOT session. Mean IOP values were higher than baseline values at controls 3 months after the end of HBOT. However, there was no case with IOP above 21 mmHg.
No statistically significant difference was observed when CCT values and the six quadrants RNFL were compared with baseline values (Table 1, 2).
At the baseline of the gonioscopic examination, the anterior chamber angles of all the patients were open and slightly pigmentation was present. There was also no difference in the anterior chamber angle examination with the Goldman three-mirror contact lens and optical disc head, peripapillary region, diabetic retinopathy stage in the FFA taken at the end of HBOT compared with initial values. None of the patients required laser or anti-vascular endothelial growth factor treatment during the study period.
HbA1c values were 7.4 ┬▒ 1.9% in mild-moderated DRP, 8.1 ┬▒ 2.3% in patients with severe DRP, and 7.3 ┬▒ 1.9% in patients who had previously received argon laser and inactive DRP. The mean HbA1c values of 7 patients with IOP >21 mmHg were 8.2 ┬▒ 0.9 mg/dL, and there was significant differences compared with those of patients with IOP values Ōēż21 mmHg (7.4 ┬▒ 2.8 mg/dL) (p = 0.001). There was also significant differences in IOP-1, IOP-2 and IOP-3 values between groups that is created according to the HbA1c levels (p < 0.05) (Table 3 and Fig. 2).
Discussion
For over 50 years HBOT has been regularly used for chronic wound care and yet the underlying mechanisms, clinical effectiveness and side effects are rightly still called into question. When DFU do not heal despite adequate conservative management or progress, HBOT can be considered as an adjuvant therapy [13]. One of crucial effects of HBOT is an increase in angiogenesis activity that leads toformation of new blood vessels and hence increase in nutrients supply to the hypoxic tissue [14,15]. There has been a considerable debate on the relationship between HBOT and ROS production in ocular tissues. ROS is associated with several ocular diseases including keratoconus, myopia, cataract, age-related macular degeneration, and glaucoma [7,16-19]. Myopia can be a direct toxic effect of oxygen on the crystalline lens and is the most common side effect of HBOT [16]. Long-term exposures to intensive HBOT were found to be associated with the development of nuclear cataract in support of the theory of associated oxidative damage to the lens proteins [17]. Oxidative stres induce degeneration and death of the retinal pigment epithelium with age-related macular degeneration [18]. For patients who have or are at risk for developing age-related macular degeneration, there may be adverse consequences from increased exposure to ROS associated with HBOT.
Oxidative stress may have a role in the pathogenesis of glaucoma, through degradation of the trabecular network [19]. TM is the most sensitive tissue of the anterior chamber to the oxidative damage. Increased ROS levels and the oxidative stress damage mainly structural and functional components of mtDNA in TM endothelial cells, remodeling of TM cytoarchitecture and this leadsto TM enlargement or collapse [19-21]. Therefore, its oxidative-related enlargementor collapse leads to the increased outflow resistance andelevation of IOP [20]. Previous studies have shown that oxidative stress can elevate IOP [22,23]. Blood and aqueous humour ROS levels in glaucoma patients were found to be significantly higher than in controls [22]. Analysis of blood plasma samples found that total antioxidant status was decreased in patients with glaucoma [24,25].
There are very few publications in the literature on how IOP fluctuations are affected during HBOT and after the end of treatment. Gallin-Cohen et al. [26] found that HBOT has been associated with a reduction of IOP in rabbits. In other studies conducted by Bojic et al. [27] and Bojic et al. [28], it is showed that HBOT is not significant alterations on IOP in patients with glaucoma. However, Ersanli et al. [29] claimed that IOP was reduced significantly by a mean 1.85 mmHg during HBOT (2.5 bar) in their study. In our study, IOP measurements during the study and controls 3 months after the end of the HBOT were statistically higher than the baseline values. Unlike previous studies, the subjects in our study were patients without glaucoma before HBOT and all with type 2 DM. The IOP increase in our patients may be due to HBOT or the additional contribution of type 2 DM. Larger clinical studies evaluating the effect of future HBOT on IOP will clarify this problem.
In our study, when examined IOP changes of 46 patients with type 2 DM who were treated with HBOT for 30 sessions with diabetic foot ulser diagnosis, IOP measurements of seven (15.2%) eyes after the 10th session of treatment were above 21 mmHg (between 22 and 28 mmHg). IOP measurements of these subjects were also above 21 mmHg during HBOT. After the last session HBOT, topical anti-glaucomatous drops were started in these eyes. When these patients were compared with those of IOP Ōēż21 mmHg, their HbA1c values were higher than those of patients with IOP values Ōēż21 mmHg. This result shows that poor blood glucose regulation may cause IOP elevation in HBOT cases. Hyperglycemia and high HbA1c levels lead to free radical production by glucose oxidation, non-enzymatic glycation of proteins and elevation of lipid peroxidation [30,31]. Exaggerated ROS production triggering by hyperglycemia can reduce the antioxidant enzyme activities directly. Both free radical formation by HBOT and poor blood glucose regulation may exceed the neutralizing capacity of antioxidant systems of the eye, and HBOT-related side effects may increase in these patients.
The use of antioxidants is critical to combat the oxidative stressors caused by the production of ROS and for the maintenance of homeostasis. Under conditions of ROS overproduction, supplementation with compounds of a high antioxidant potential is immensely valuable. The use of antioxidant compounds in the treatment of glaucoma have been previously studied. Some previous animal and human studies found that antioxidant supplementation can improve insulin resistance and decrease blood glucose concentrations and HbA1c [32-34]. On the other hand, vitamin E, N-acetylcysteine, and resveratrol have previously been shown to be beneficial in the management of primer open glaucoma [35,36]. Furthermore, the consumption of flavonoid containing foods has been found to reduce the overall risk of primer open glaucoma and benefit longterm visual function [37]. Hodges et al. [38] found that intravenously administration of 1 mg/kg myricetin decreased IOP in normotensive rabbits. Based on these studies, antioxidant supplementation may be considered to prevent ocular side effects such as IOP increase due to ROS in DFU patients receiving HBOT treatment.
As it is known, CCT values affect IOP measurements. We not observed any significant differences in CCT values during our study compared with baseline values. Similar findings were found in the study of Ayata et al. [39]. The study measured CCT with an ultrasonic pachymeter before and immediately after HBO treatment, which lasted 120 minutes at 2.4 atmospheres absolute with three 30-min oxygen and two 5-minute air breathing periods. They foud that HBO treatment did not change the CCT in diabetic subjects, however, the CCT was significantly reduced after HBO treatment in nondiabetic subjects. Our study was different than the Ayata et al. [39] study that was containing a non-diabetic control group, but our study did not include non-diabetic patients.
In our study, we also detected that although there was a significant increase in IOP, no change was detected in RNFL examination. This result suggested that HBOT may have a positive effect on the optic nerve despite the increase in IOP. Although there is not any study evaluating the effect of HBOT on RNFL in the literature, some case series investigating the efficacy of HBOT in optic nerve diseases have been reported. In one of these series, HBOT administered in four cases due toradiation-induced optic neuropathy. According to this study, HBOT was useful in two patients who have received HBOT within 72 hours after visual loss, however, it was not any benefit in the other two patients who have treated with HBO two weeks after visual loss [40]. Conversely, in another study, the visual acuity improved in a patient who have treated with HBO 17 weeks after the onset of radiation-induced optic neuropathy [41].
HBOT provided significant improvement of visual acuity and field in patients with non-arteritic anterior ischemic optic neuropathy [42]. HBOT also temporarily improves visual symptoms in patients with multiple sclerosis [43]. Nevertheless, HBOT can not be recommended in these patients until more advanced and well-designed studies are reported.
One of the two important results we obtained in our study is that HBOT may increase IOP, especially in patients with impaired blood glucose regulation. For this reason, IOP follow-up should be strictly performed in patients with poor blood glucose levels, and supplementation with an anti-oxidant agent may be considered as an option in these cases. Another result is not observed any changes in RNFL thichness in spite of increase in IOP values.
One of the main limitations of the study is that the effect of HBOT on IOP change in individuals without diabetes could not be investigated. Secondly, we have not demonstrated the histopathologic effects of HBOT on ocular tissue samples such as trabeculum that is more accurate approach to evaluate the results of this study, however; this is only possible by examining animal experiments and/or dead human tissue specimens.
In the light of our study results, studies involving ROS measurements in anterior chamber samples can be performed to find the reasons for IOP increase in HBOT treatment. In addition, the effects of antioxidant therapy on IOP may be investigated in diabetic patients with poor blood glucose regulation during HBOT.

 PDF Links
 PubReader
 ePub Link
 Full text via DOI
 Full text via PMC
 Download Citation
 Print
Print


