

Optical coherence tomography (OCT) has gained importance in the assessment of the microstructure of the eyeball [1,2,3,4,5,6]. Spectral domain (SD)-OCT measurements of the ganglion cell inner plexiform layer (GC-IPL) thickness can be used to detect glaucoma [7,8,9]. In particular, macular ganglion cell assessment has shown good diagnostic performance in detecting central visual field (VF) defects in glaucoma [10]. Because the GC-IPL is measured in the central retina, this result is persuasive.
Traditionally, photographic evaluation of the retinal nerve fiber layer (RNFL) has been used to determine structural progression in glaucoma. The RNFL is well visualized in the superotemporal and inferotemporal areas of the optic disc. However, this layer is not always well identified in the central macula. Therefore, it would be ideal if GC-IPL measurements could be used to quantitatively detect structural change occurring in the central macula and thus be used as an adjunctive strategy to determine glaucomatous progression. Maintenance of the central VF in glaucoma patients is important for quality of life. Therefore, we intended to test the hypothesis that GC-IPL measurements can be used to detect longitudinal glaucomatous progression in the central VF.
Only two studies to date have assessed the ability of GC-IPL to detect overall glaucoma progression, with both calculating the long-term rate of change of GC-IPL thickness using a trend analysis [7,11]. In clinical practice, the use of GC-IPL measurements to determine glaucoma progression depends on the cut-off value for defining progression as well as the sensitivity of this method to detect progression. These issues were addressed in the current study by an event analysis assessing the reproducibility of GC-IPL measures. Using a cohort of preperimetric glaucoma patients who had shown long-term stability, the long-term variability was estimated, the cut-off value defining the change from baseline was calculated, and the sensitivity and specificity of these GC-IPL measures for detecting central VF progression were assessed.
Materials and Methods
Subjects
The medical records of all subjects evaluated by a glaucoma specialist (KRS) from March 2008 to May 2015 in the glaucoma clinic of the Asan Medical Center were retrospectively examined. Initial testing included a comprehensive ophthalmologic examination, including a review of the medical history, measurement of best-corrected visual acuity, slit-lamp biomicroscopy, multiple intraocular pressure measurements by Goldmann applanation tonometry, gonioscopy, a dilated funduscopic examination, stereoscopic optic disc/RNFL photography, a VF test, measurement of central corneal thickness (DGH-550 instrument; DGH Technology, Exton, PA, USA), and spectral domain optical coherence tomography (SD-OCT). Inclusion criteria at the initial assessment included a best-corrected visual acuity of 20 / 40 or better, a spherical refractive error between -6.0 and +4.0 diopters, a cylinder correction within +3 diopters, and the presence of a normal anterior chamber and an open-angle on slit-lamp and gonioscopic examinations. Subjects with glaucomatous optic disc changes, such as diffuse or focal neural rim thinning, disc hemorrhage, or RNFL defects, as confirmed by two glaucoma specialists (KRS and JYL), were included. Subjects with any other ophthalmic or neurologic condition that could result in a VF defect and subjects with a history of diabetes mellitus or severe myopic fundus precluding adequate examinations were excluded. If both eyes of the same patient were found to be eligible, one eye was randomly selected for the analysis.
All subjects with glaucoma were subjected to follow-ups at 6-month intervals, involving stereoscopic optic disc photography, RNFL photography, VF testing, and SD-OCT scanning. All tests were performed at the same visit or within 2 weeks of one another. To be included, subjects were followed for at least 3 years. All participants received medical therapy during the follow-up period. If the subject underwent intraocular surgery or laser therapy during the follow-up period, only data obtained before these operations were included.
VF tests were performed using a Humphrey field analyzer (Swedish Interactive Threshold Algorithm 24-2; Carl Zeiss Meditec, Dublin, CA, USA). Only reliable VF test results (false-positive errors <15%, false-negative errors <15%, and fixation loss <20%) were included in the analysis. VF tests were repeated for confirmation within 2 weeks of the baseline measurements. Patients were expected to return approximately 1 month after the baseline examination to assess their responses to medication and to undergo a third VF test. Therefore, all subjects underwent three VF tests within the first 6 weeks. Data from the first VF test were excluded to obviate any learning effect, and the results of the second and third VF tests, performed within 1 month of each other, were considered baseline examinations. Subjects who underwent at least five reliable VF tests, excluding the first, at separate visits were included. Participants were divided into two subgroups, those with preperimetric and those with perimetric glaucoma. Perimetric glaucomatous eyes had glaucomatous VF defects, defined as glaucoma hemifield test results outside the normal limits or a pattern of standard deviation exceeding 95% of normal limits. In addition, these eyes had to have a cluster of three points with probabilities <5% on the pattern deviation map in at least one hemifield, including at least one point with a probability <1% or a cluster of two points with a probability <1%. Glaucomatous VF defects had to be confirmed on at least two VF examinations. The study protocol was approved by the institutional review board of Asan Medical Center, and the study design followed the principles of the Declaration of Helsinki.
Spectral domain optical coherence tomography
SD-OCT images were obtained using a Cirrus HD-OCT system (Carl Zeiss Meditec), which was calibrated regularly by a technician employed by the manufacturer. Pupil dilation was performed if necessary. All accepted images exhibited a centered optic disc or macula; were well-focused, with even and adequate illumination; exhibited no eye motion within the measurement circle; and had signal strength ≥7. For inclusion in the progression analysis, at least five acceptable OCT images had to be obtained on separate visits, with all images meeting the requirements for image quality.
Average circumpapillary RNFL (cRNFL) thickness was determined in the optic disc cube mode, and the average and sectoral GC-IPL thicknesses were measured in the macular cube mode. GC-IPL parameters included the average, minimum, and six sector (superotemporal, superior, superonasal, inferonasal, inferior, and inferotemporal) GC-IPL thicknesses. The image acquisition procedure has been described in detail elsewhere [12,13].
Analysis of progressive VF and optic disc/RNFL changes
The overall progression of the VF was determined using commercial software (Humphrey Field Analyzer Guided Progression Analysis, Carl Zeiss Meditec) and was defined as a significant deterioration from the baseline pattern, with a deviation at three or more of the same test points evaluated on three consecutive examinations or as a significantly negative slope (p < 0.05) on a linear regression analysis using VF index data (overall progression criterion) [14]. If VF progression was present within the central 10° (i.e., a significantly deteriorated point on three consecutive examinations within the central 10°), the case was considered central VF progression [15].
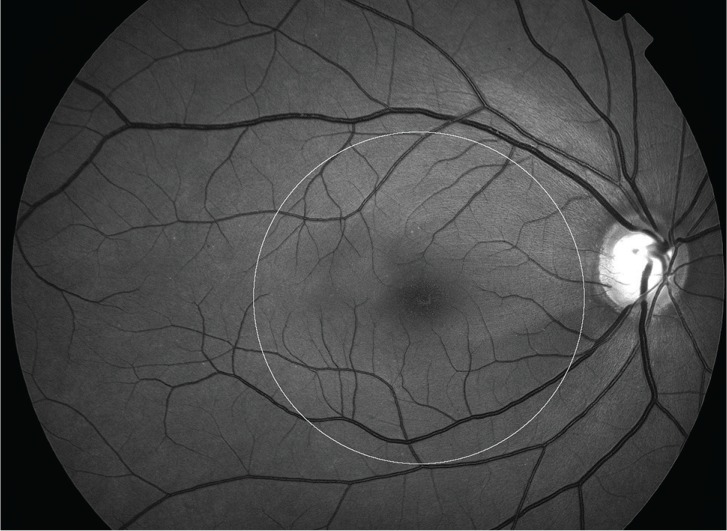
Progression of the RNFL in the central area was determined by evaluation of the entire series of red-free RNFL photographs displayed on a liquid crystal display monitor. Two glaucoma experts (KRS and JEL) independently assessed all photographs to estimate glaucoma progression. The two graders were not aware of the other's progression assessments and were masked to all clinical, OCT, and VF information. Each grader viewed all photographs of each eye before making an assessment and then classified each glaucomatous eye as either stable or progressing. In this study, progression of RNFL defects inside the macular 6.0-mm-diameter circle on red-free RNFL photographs, corresponding to the area in the GC-IPL map, was considered central RNFL photographic progression (Fig. 1) [16]. If the opinions of the two graders differed, consensus was reached after discussion, and if consensus was not reached, that eye was excluded from the subsequent analyses.
Analysis
Of the 219 preperimetric eyes initially evaluated, 180 were found to be stable in the VF and RNFL photographic assessments during the follow-up period. Among 180 eyes, 110 eyes were randomly chosen for an assessment of long-term variability of SD-OCT measurement. The intraclass correlation coefficient, coefficients of variation, and intersession test-retest variabilities were calculated for average cRNFL thickness and for average, minimum, and the six sector GC-IPL thicknesses on serial Cirrus SD-OCT scans obtained at 6-month intervals. In this present study, the intersession test-retest variability was defined as 1.96- and 1.28-fold greater than the inter-visit standard deviations for the 95% and 80% confidence intervals, respectively.
If any change from baseline exceeded the test-retest variability in a negative direction in two consecutive follow-up SD-OCT tests, that eye was regarded as showing progression. The sensitivity and specificity of Cirrus SD-OCT for detecting progression using two VF criteria (overall and central) were determined for (1) average cRNFL thickness, (2) average GC-IPL thickness, (3) minimum GC-IPL thickness, (4) ≥1 sector in GC-IPL thickness, and (5) thickness of each of the six GC-IPL sectors during the follow-up period. The sensitivity and specificity for detecting central VF progression of GC-IPL thickness and RNFL photographic progression in the central area were compared using McNemar's test. All statistical analyses were performed using commercial software IBM SPSS ver 22.0 (IBM Corp., Armonk, NY, USA), with p < 0.05 considered statistically significant.
Results
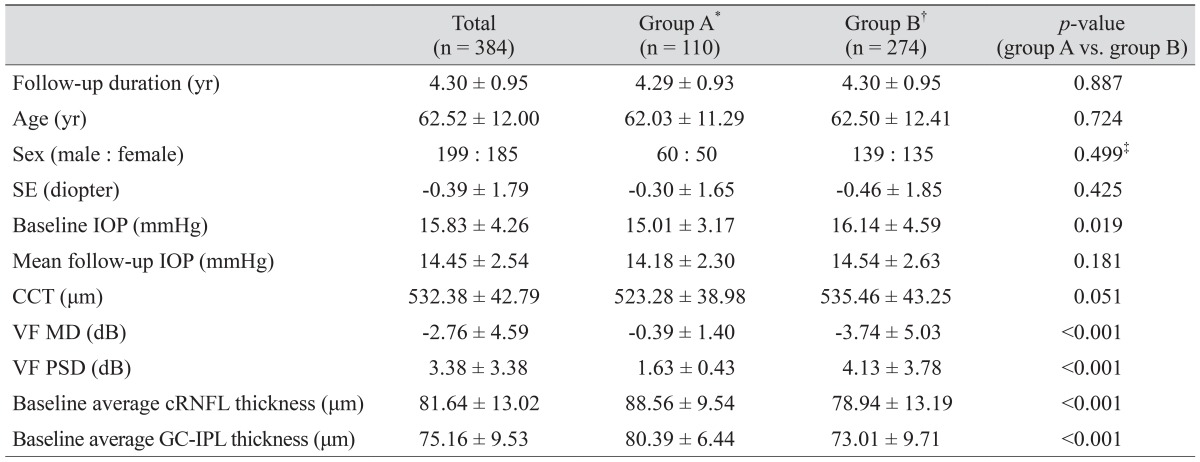
A total of 35 of 419 eyes (8.4%) that met the other inclusion criteria were excluded due to a disagreement between the two graders regarding the RNFL progression assessment. Therefore, a total of 384 eyes from 384 patients with glaucomatous optic disc changes, including 219 preperimetric and 165 perimetric glaucomatous eyes, were included in our final study cohort. The mean follow-up period (± standard deviation) was 4.30 ± 0.95 years, and the mean numbers of analyzed optic disc/RNFL photographs, SD-OCT images, and VFs were 7.82 ± 1.51, 7.74 ± 1.52, and 7.60 ± 1.43 per eye, respectively. Of the 219 preperimetric eyes, 180 did not progress, according to either RNFL or VF assessment. Of these 180 eyes, 110 were used to assess the variability of SD-OCT measurement, as described earlier. The remaining 109 preperimetric eyes and 165 perimetric glaucomatous eyes were included in the main analysis. The mean age and follow-up period did not differ between these two groups (Table 1). Of the 109 preperimetric eyes included in the main analysis, seven showed progression by the overall VF criterion and three by the central VF criterion. Of the 165 perimetric eyes, 38 showed overall VF progression and 25 showed central VF progression.
Long-term variability of the SD-OCT measurement
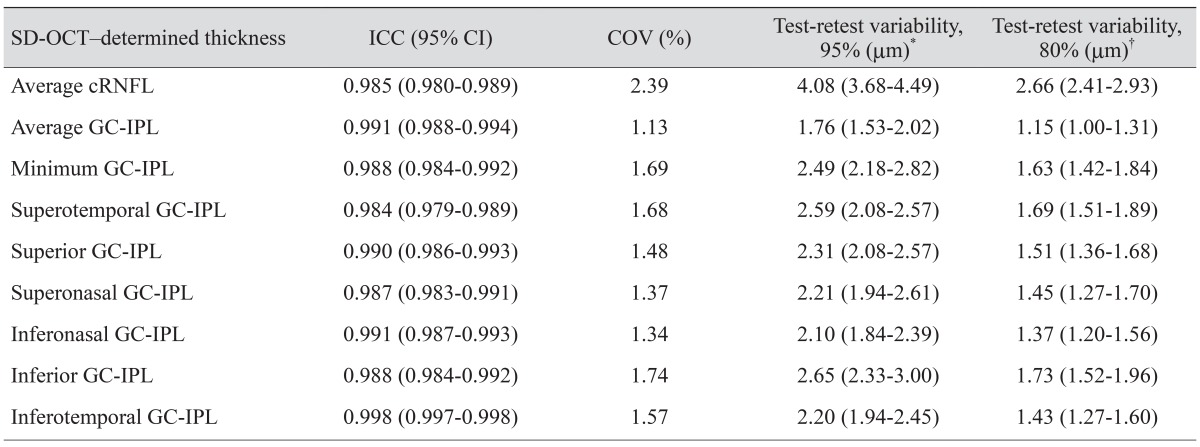
The intraclass correlation coefficients, which ranged from 0.984 to 0.998, were excellent for average cRNFL thickness and all GC-IPL measurements. All coefficients of variation were <3%. The test-retest variabilities, defined at the 95% confidence level, were 4.08 mm for average cRNFL thickness and 1.76 mm for average GC-IPL thickness (Table 2).
Sensitivity and specificity of SD-OCT parameters to detect overall and central VF progression
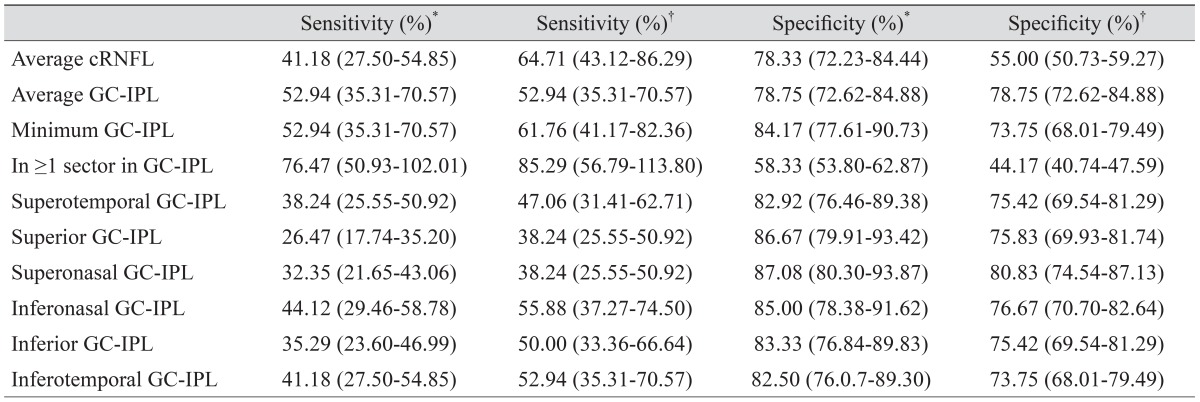
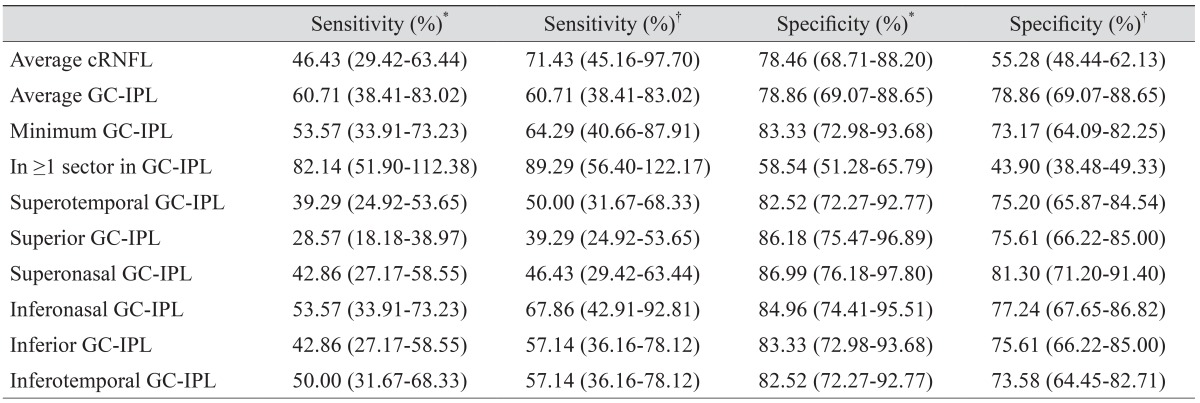
At the 95% confidence level, the sensitivity of GC-IPL thickness to detect overall VF progression ranged from 26.5% (for the superior GC-IPL sector) to 76.5% (for ≥1 sector GC-IPL) (Table 3). At the 95% confidence level, the sensitivity of GC-IPL thickness to detect progression ranged from 28.6% (for the superior GC-IPL sector) to 82.1% (for ≥1 sector GC-IPL), and specificities ranged from 58.5% (for ≥1 sector GC-IPL) to 87.0% (for the superonasal GC-IPL) when using the central VF criterion (Table 4).
Comparison of RNFL photographic assessment and GC-IPL parameters to detect central VF progression
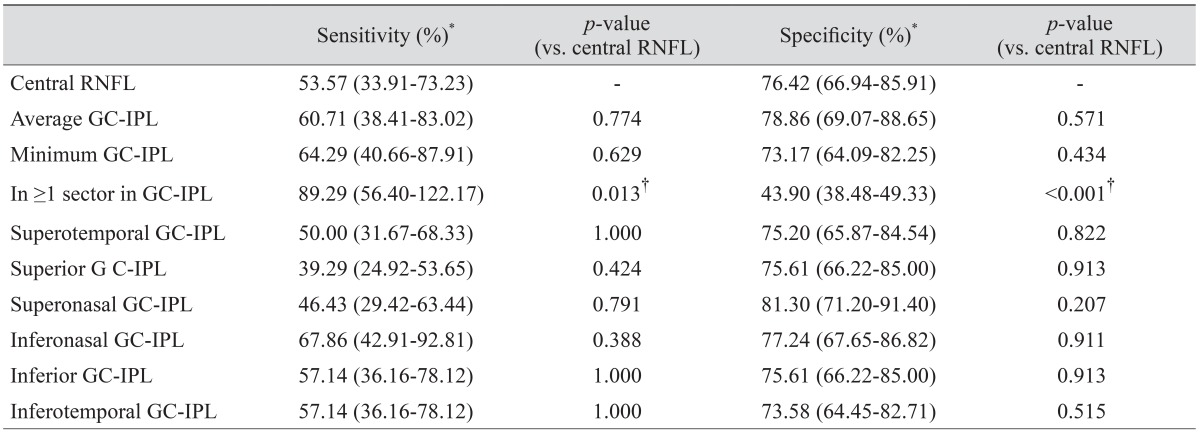
At the 80% confidence level, the sensitivities of the average and minimum GC-IPL parameters to detect central VF progression did not differ significantly from the central RNFL photographic assessment (60.7% vs. 53.6% and 64.3% vs. 53.6%, respectively). However, the sensitivity of GC-IPL (≥1 sector) was significantly higher than that of central RNFL photographic progression (89.3% vs. 53.6%, p = 0.013), whereas the specificity was significantly lower (43.9% vs. 76.4%, p < 0.001) (Table 5).
Discussion
Although the OCT measure of RNFL thickness showed good capability in diagnosing glaucoma, it was not as effective in its ability to detect disease progression. Previous publications have reported poor to moderate agreement of OCT measurements of RNFL thickness with optic disc/RNFL photographic or VF assessment, methods that are considered reference standards for detecting glaucomatous progression [7,17,18,19]. One possible reason why OCT measures of RNFL thickness showed poor ability to detect progression may be that the measurements have lower reproducibility in actual clinical practice than measurements obtained during well-designed evaluations. Reproducibility is necessary to precisely detect significant changes over time. Thus, our assessment of longitudinal variability had two purposes. The first was to determine whether longitudinal variability in real clinical practice is within an acceptable range, and the second was to determine the practical cut-off values for defining changes in GC-IPL thickness. In previous studies, GC-IPL measurements by SD-OCT showed good reproducibility in both healthy and glaucomatous eyes [20,21,22]. The previously determined long-term reproducibility of GC-IPL measurements was similar to that of our results [21]. In our current study, the intraclass correlation coefficient of the average GC-IPL thickness was 0.991 and the coefficient of variation was 1.13% in stable preperimetric glaucomatous patients, with these patients showing excellent long-term test-retest reproducibility.
With an event-based analysis using the calculated variability as a cut-off, we found that GC-IPL parameters had moderate levels of sensitivity and specificity in detecting overall glaucomatous VF progression. However, sectoral GC-IPL parameters, defined as the 95% confidence level, were less sensitive in detecting progression than was average GC-IPL thickness. This may have been due to the greater test-retest variability of sectoral GC-IPL than of average or minimum GC-IPL thickness.
The RNFL is thickest in the superotemporal and inferotemporal areas and, thus, is well visualized in these regions, allowing the detection of changes in these regions using RNFL photography. However, the RNFL in the macular area is thinner than cRNFL and not well identified in some eyes. Therefore, we hypothesized that SD-OCT is more sensitive than RFNL photographic assessment in detecting changes in GC-IPL thickness and thereby detecting central VF progression. When central VF progression is considered a reference standard, the average change in GC-IPL thickness change was similar to RNFL photographic assessment, but the one-sector change in GC-IPL thickness showed better performance. Thus, measuring the change in GC-IPL thickness may be an adjunctive strategy, especially when the RNFL is poorly visualized. However, the specificity for this parameter was lower than that for cRNFL. Therefore, GC-IPL parameters demonstrated comparable sensitivity and specificity to RNFL photographic assessment in detecting VF progression that has developed in the central retina.
To our knowledge, our present study is the first to investigate the ability of GC-IPL measurements to detect overall and central VF progression using an event analysis. However, our study had several limitations. First, the follow-up period was relatively short. Second, the limits of test-retest variability derived from stable preperimetric patients may not be identical to those from other patients.
In conclusion, GC-IPL parameters with Cirrus SD-OCT show excellent long-term reproducibility. Using an event-based analysis incorporating our own reproducibility data, the diagnostic sensitivities of GC-IPL measurements are similar to those of RNFL photographic assessment in the prediction of glaucomatous central VF progression.
 PDF Links
 PubReader
 Full text via DOI
 Full text via PMC
 Download Citation
 Print
Print


