


High myopia is defined as a refractive error with a spherical equivalent (SE) ŌēżŌłÆ6.0 diopters (D). The prevalence of myopia has been reported to be as high as 80% in Asia and 22.9% in other regions of the world [1,2]. Because of its increasing prevalence in eastern and southeastern Asian countries, including Singapore, China, Taiwan, Japan, and the Republic of Korea, it has been an important public health problem in the past 50 to 60 years [3].
Although most refractive errors can be corrected with glasses or contact lenses, high myopia can cause irreversible retinal disorders such as chorioretinal atrophy, choroidal neovascularization, and macular retinoschisis due to the small fiber diameters and histological immaturity [4-6]. It is therefore important to identify the conformational changes that occur in highly myopic eyes.
Optical coherence tomography (OCT) is a non-invasive diagnostic tool that is used to obtain a cross-sectional retinal image with fine resolution, which facilitates the assessment of the microstructural retinal layers [7]. Using Fourier domain OCT, Malakar et al. [8] reported that the retinal nerve fiber was significantly thinner in myopic eyes than in emmetropic eyes. Read et al. [9] analyzed macular thickness and individual retinal layer thicknesses using spectral-domain (SD) OCT and reported parafoveal or perifoveal thinning in most outer and inner retinal layers associated with myopia in a population of 10- to 15-year-old children. However, only a few studies have investigated the retinal layer thicknesses associated with adult myopic eyes without maculopathy, which could cause segmentation errors when analyzing the thickness of each layer.
In the present study, we evaluated the differences in retinal layer thickness in adult patients with high myopia without retinal or optic nerve diseases, by comparing their eyes with those of normal subjects.
Materials and Methods
Patients
This retrospective, cross-sectional study was approved by the institutional review board (2019-12-014) and adhered to the tenets of the Declaration of Helsinki. Patients who visited our retinal clinic and were examined between January 2016 and October 2019 were enrolled. The requirement for informed consent was waived due to the retrospective nature of the study. The high myopia group consisted of eyes with axial lengths (ALs) of Ōēź26.0 mm, and the control group consisted of eyes with SEs between +3.0 and ŌłÆ6.0 D and AL of <26.0 mm.
Each patient underwent a complete ophthalmic examination, which included best-corrected visual acuity (BCVA), intraocular pressure (IOP) using non-contact tonometry, refraction, AL using an IOL Master 500 (Carl Zeiss, Jena, Germany), and keratometry. We used a Snellen visual acuity chart to measure the BCVA, which was converted into logarithm of the minimum angle of resolution. The exclusion criteria were as follows: BCVA <20 / 25; IOP Ōēź21 mmHg; a medical history of any systemic disease such as diabetes or hypertension; any ophthalmic disease that could affect the retinal layer thickness such as glaucoma and retinal and neuro-ophthalmic diseases; structural change caused by high myopia, including staphyloma, lacquer cracks, myopic neovascularization, which could induce processing errors such as individual retinal layer segmentation; a history of intraocular surgery except cataract extraction.
OCT measurements
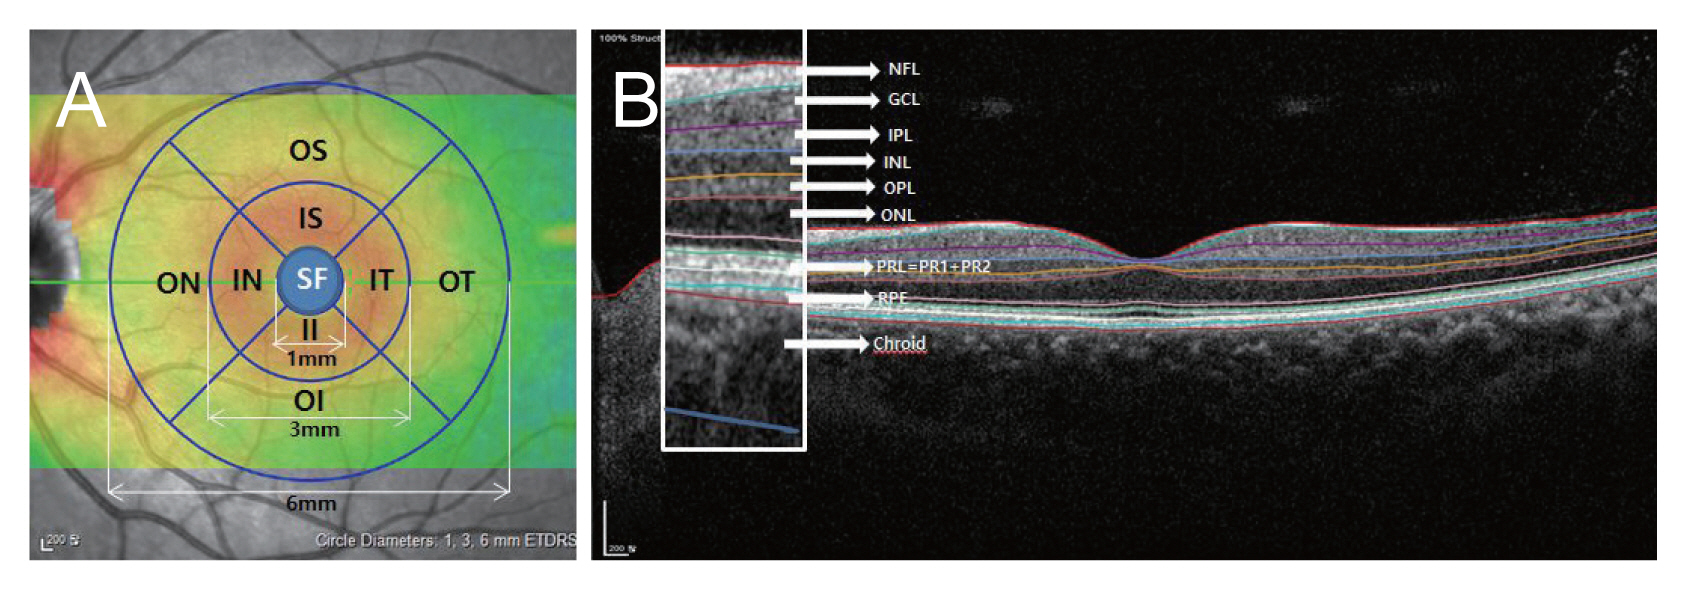
An experienced examiner obtained the measurements using SD-OCT (Spectralis; Heidelberg Engineering, Heidelberg, Germany). The foveal measurements obtained by the SD-OCT scan were performed using the built-in Spectralis mapping software, Heidelberg Eye Explorer ver. 6.9a. We used retinal thickness map analyses to display numeric averages of the measurements for each of the nine Early Treatment Diabetic Retinopathy Study (ETDRS) subfields (Fig. 1A). The inner (subfovea, SF), intermediate (parafovea), and outer rings (perifovea) with diameters of 1, 3, and 6 mm, respectively, were analyzed.
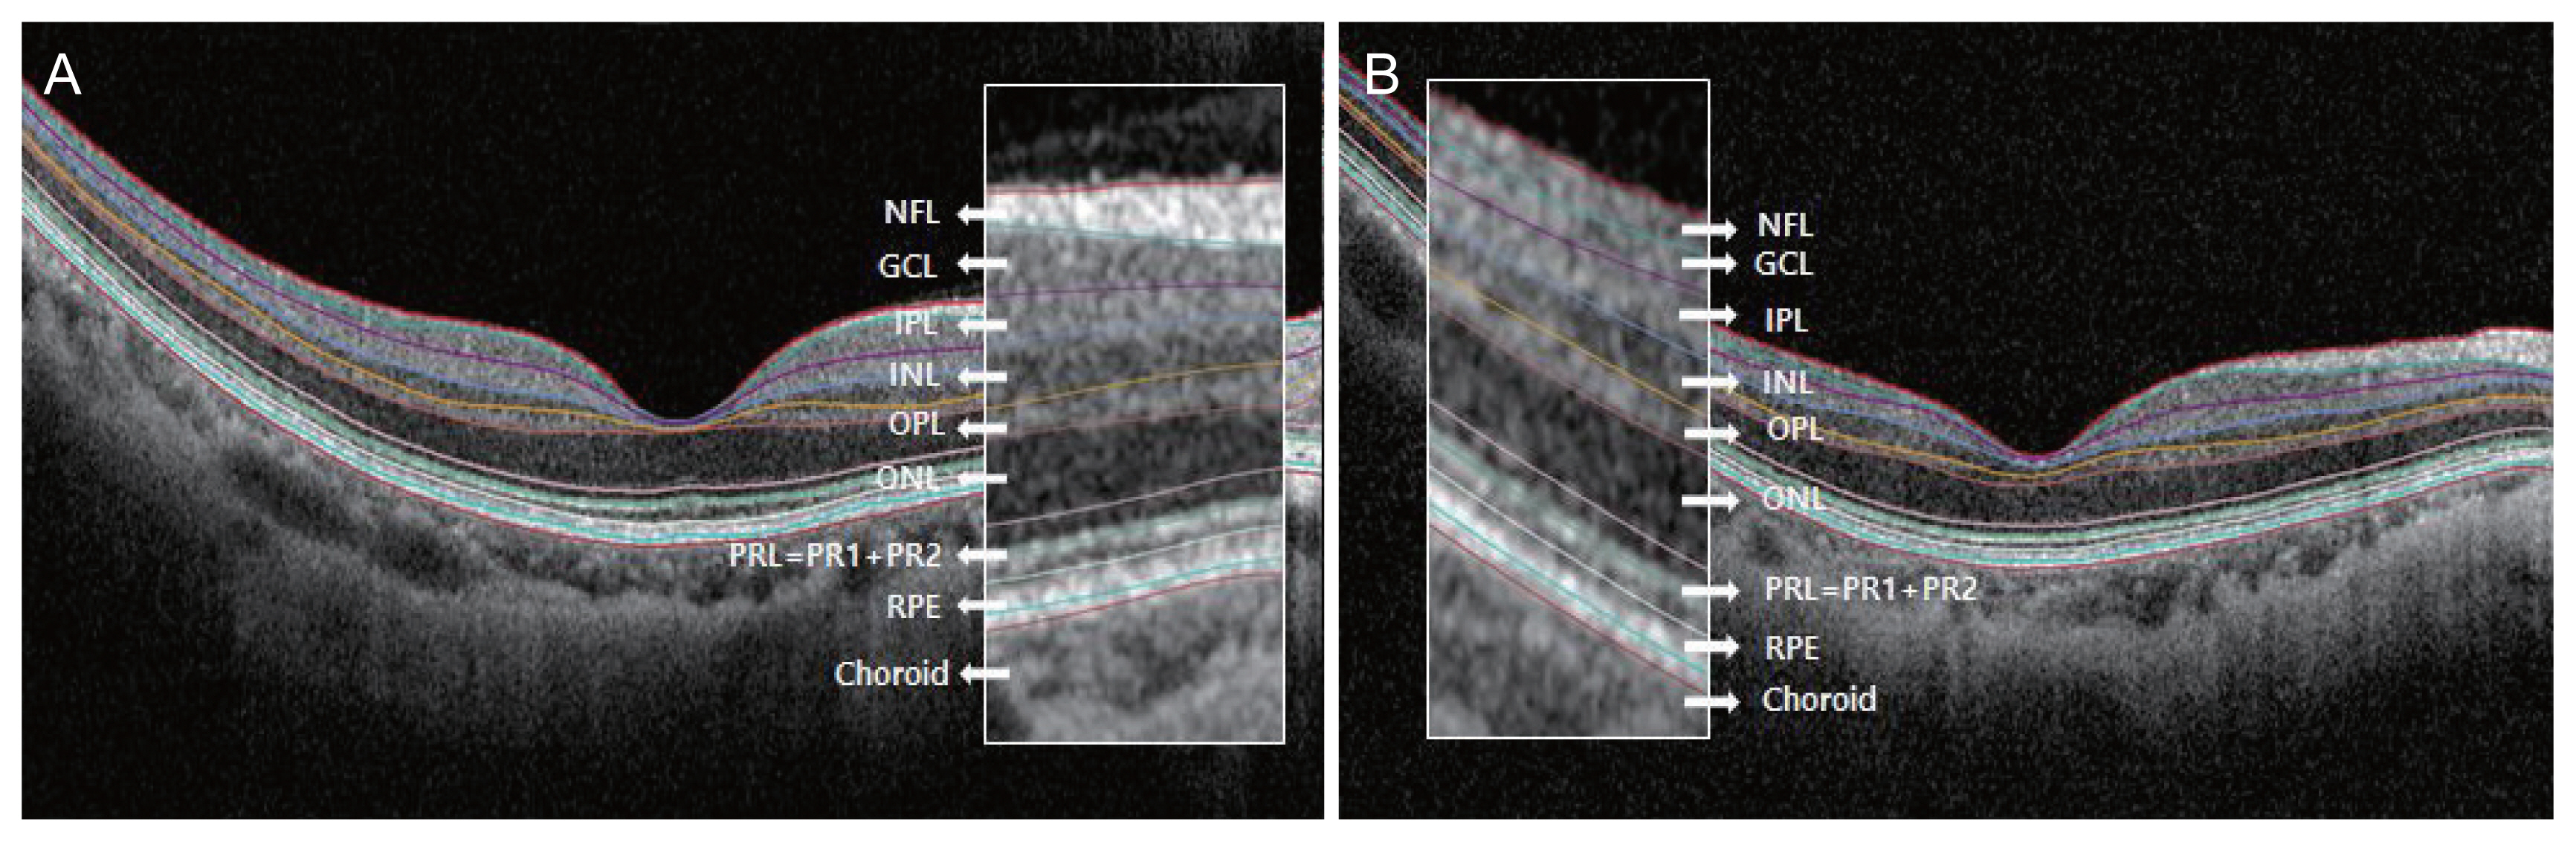
The average thicknesses of the following nine zones were used in the analyses: SF, inner superior (IS), inner nasal (IN), inner inferior (II), inner temporal (IT), outer superior (OS), outer nasal (ON), outer inferior (OI), and outer temporal (OT). Automated retinal layer segmentation was conducted and the thickness of each layer of the nine zones was determined using automated Spectralis segmentation software. The thicknesses of the full retina, retinal nerve fiber layer (NFL), ganglion cell layer (GCL), inner plexiform layer (IPL), inner nuclear layer (INL), outer plexiform layer (OPL), outer nuclear layer (ONL), photoreceptor layer (PRL), and retinal pigment epithelium (RPE) were obtained (Fig. 1B, 2A, 2B). Choroidal thickness was measured in the subfoveal area from the BruchŌĆÖs complex to the chorioscleral junction. Images were obtained using the Spectralis OCT system only when the quality score was >15. All scans showing a motion artifact, involuntary saccade, obvious decentration, misalignment, or algorithm segmentation failure were excluded.
Statistical analyses
The ocular parameters in the highly myopic and control groups were compared using an independent t-test. The retinal layers were divided into three according to capillary vascularity: superficial capillary plexus (NFL, GCL, and IPL), deep capillary plexus (INL and OPL), and outer retinal layer (ONL, PRL, and RPE), and their thicknesses were analyzed. The statistical analyses were performed using PASW Statistics ver. 18.0 (SPSS Inc., Chicago, IL, USA).
Results
Demographics
A total of 74 eyes of 62 participants and 37 eyes in each group were enrolled. The mean ages of the highly myopic and control groups were 42.95 ┬▒ 12.3 and 47.73 ┬▒ 13.3 years, respectively, which were not significantly different (p = 0.114) (Table 1). Nine of 37 patients in the high myopic group had refractive surgery and their ALs were longer than 26.0 mm, whereas the SE ranged from ŌłÆ0.5 to +0.5 D. The mean BCVA (logarithm of the minimum angle of resolution) and IOP were 0.02 ┬▒ 0.03 and 13.6 ┬▒ 3.3 mmHg in the highly myopic patients and 0.02 ┬▒ 0.03 and 14.3 ┬▒ 3.6 mmHg in controls, respectively, which were also not significantly different (p = 0.338 and p = 0.370, respectively). The average SEs and ALs of the highly myopic and control groups were significantly different: ŌłÆ6.42 ┬▒ 3.96 versus ŌłÆ2.35 ┬▒ 2.40 D (p < 0.001) and 27.28 ┬▒ 0.96 versus 24.47 ┬▒ 0.95 mm, respectively (p < 0.001).
Retinal layer thicknesses of the superficial capillary plexus
The mean SF thicknesses of the NFLs of the high myopia and control groups were 11.24 ┬▒ 2.30 and 11.54 ┬▒ 2.97 ╬╝m, respectively (Table 2). There were no statistically significant differences between most of the mean thicknesses of the nine zones of the NFL except for segment II, which were 27.03 ┬▒ 4.82 and 24.35 ┬▒ 3.28 ╬╝m for the highly myopic and control groups, respectively (p = 0.007).
The mean SF thicknesses of the GCLs (14.81 ┬▒ 4.96 and 14.89 ┬▒ 9.97 ╬╝m, respectively) and IPLs (18.46 ┬▒ 3.83 and 19.30 ┬▒ 6.32 ╬╝m, respectively) of the highly myopic and control groups were not statistically different. In addition, there were no significant differences among the mean thicknesses of the intermediate ring segments of the nine zones (IS, IN, II, and IT). However, the outer ring segments of the nine zones (OS, ON, OI, and OT) were thinner in the highly myopic group than in the control group (all p < 0.05) (Fig. 3A, 3B).
Retinal layer thicknesses of the deep capillary plexus
The mean SF thicknesses of the INLs (18.46 ┬▒ 5.49 and 19.46 ┬▒ 7.31 ╬╝m, respectively) and OPLs (29.49 ┬▒ 9.49 and 26.70 ┬▒ 8.76 ╬╝m, respectively) of the high myopia and control groups were not statistically different (Table 3). In the INL, the mean thicknesses of all intermediate and outer ring segments were thinner in the highly myopic group than in the control group (all p < 0.050). In the OPL, the mean segmental thickness was thinner in the highly myopic patients than in the controls in most segments: IS, II, OS, OT, and ON (all, p < 0.05).
Outer retinal layer and choroidal thicknesses
The mean SF thicknesses of the ONL were 81.70 ┬▒ 13.07 and 90.84 ┬▒ 11.87 ╬╝m in the highly myopic and control groups, respectively, which were significantly different (p = 0.002) (Table 4). In addition, several segments (SF, IT, II, IN, OT, and OI) were thinner in the high myopia group than in the control group (all p < 0.05).
In the PRL, the mean SF thicknesses (72.86 ┬▒ 3.35 and 72.37 ┬▒ 4.47 ╬╝m, respectively) were not statistically different. In addition, there were no statistical differences between the segments.
In the RPE, the mean SF thicknesses (16.62 ┬▒ 2.92 and 16.73 ┬▒ 1.92 ╬╝m, respectively) were not statistically different. There were no statistically significant differences among most of the mean thicknesses of the nine zones of the RPE, except for the IN segment, which were 14.86 ┬▒ 1.70 and 15.73 ┬▒ 1.82 ╬╝m in the highly myopic and control groups, respectively (p = 0.038).
The mean choroidal thicknesses were 153.81 ┬▒ 64.80 and 239.54 ┬▒ 44.28 ╬╝m in the highly myopic and control groups, respectively, which were significantly different (p < 0.001).
Discussion
Highly myopic eyes can undergo several structural changes. Saka et al. [10] reported that myopic patients showed an increase in AL within 2 years and even in the fourth decade of life. Lee et al. [11] also reported that highly myopic eyes without conformational abnormalities showed a consistent increase in AL over 4 years, and eyes with a greater baseline AL showed a greater increase in AL. Such consistent changes in AL may cause tessellation, peripapillary atrophy, posterior staphyloma, and lacquer cracks [12], which can cause visual impairment in patients with high myopia. Clinicians should be aware of these changes and carefully evaluate the structural changes in the myopic eyes. We analyzed the retinal layer thicknesses of adult patients with high myopia based on the ETDRS subfields and compared them with those of normal controls.
Several previous studies have reported a relationship between the peripapillary retinal nerve fiber layer (pRNFL) and myopia. Leung et al. [13] reported that pRNFL thickness decreased in long eyes and those with negative SE; thus, pRNFL measurements should be interpreted carefully in myopic patients and the normative database should not be solely relied on. A previous longitudinal study reported that highly myopic eyes had a significantly greater decrease in pRNFL over 2 years than in normal eyes [14]. Budenz et al. [15] also reported that for every 1-mm increase in AL, the mean pRNFL was thinner by approximately 2.2 ╬╝m in normal subjects. However, in the present study, there were no statistically significant differences among most of the mean thicknesses of the nine zones of the NFL, except for segment II. Unlike in a previous study, which analyzed pRNFL thicknesses, we measured the retinal layer thicknesses using the ETDRS subfields. The NFL thickness was thinner in the macular area than in the peripapillary area, which did not seem to be significantly different in the highly myopic and normal eyes.
Previous studies have reported that the average thickness of all sectors of the ganglion cell (GC)-IPL is significantly lower in patients with high myopia and significantly correlated with SE and AL [16-18]. In a previous longitudinal study, GC-IPL thickness was lower, and the rate of GC-IPL reduction was higher in patients with high myopia than in normal subjects. Moreover, the reduction rate was higher in older subgroups than in younger subgroups, which was more prominent in the high myopia group [7]. We analyzed all retinal layer thicknesses based on the ETDRS subfields and found that the perifoveal GC-IPL, which comprises outer ring segments based on the ETDRS subfields, were thinner in the highly myopic group than in the control group. Jonas et al. [19] reported that equatorial and pre-equatorial retinal thicknesses decreased with axial elongation, whereas foveal retinal thickness was not affected by AL, supporting the possibility that myopic enlargement of the globe occurs predominantly by axial elongation of the globe walls in the midperiphery [20]. Our results were consistent with reports that thinning of the perifoveal GC-IPL, which is relatively distant from the central fovea, occurred in highly myopic eyes.
Thinning of the outer retinal layers occurs in pathological myopia [21]. In a previous study, the mean thickness of the ONL decreased significantly with increasing AL in the equatorial region (beta ŌłÆ1.07, p = 0.001) [19]. We measured each outer retinal layer thickness, and for several sectors (SF, IT, TT, IN, OT, and OI) of the ONL, the mean thickness was lower in the high myopia group than in the control group (all p < 0.05); however, there were no statistically significant differences between the RPE and PRL thicknesses. Thus, ONL thinning in highly myopic eyes may significantly contribute to the thinning of the outer retinal layer. The inner and outer retinal thinning in highly myopic eyes may result from the tangential stretching force on the inner retina and the anteroposterior tractional force on the outer retina because of the myopic globe expansion [22]. In our study, most segments of the INL and OPL were thinner in the highly myopic eyes than in the normal eyes, and we hypothesized that the INL and OPL were also affected by stretching and tractional forces.
Previous studies have reported a relationship between the disruption of photoreceptors and visual function in highly myopic patients. The disruption of the foveal ellipsoid zone and defects of the inner and outer segments, which involve the sublayer of photoreceptors, may be found in myopic eyes with poor vision [23-25]. In a previous study [21], the myoid and ellipsoid zone (MEZ) was thinner in pathological high myopia patients than in emmetropic and non-pathological high myopia patients (p < 0.05), and MEZ thinning was associated with a poor BCVA (p < 0.001). However, the thicknesses of the MEZ layer of the patients with non-pathological high myopia and emmetropia were not statistically different. Because we only included highly myopic patients without pathological changes, there were no significant differences between the PRL thicknesses. Thus, there no significant differences between the BCVAs of the two groups. However, because of the consistent increase in AL in highly myopic eyes, including moderately myopic eyes over time [11], physicians should closely observe PRL changes in highly myopic patients.
Previous studies have reported choroidal thinning in high myopia [26,27], and our findings are consistent with these reports. Excessive global elongation in pathological myopia could cause thinning of the choroid, resulting in various degenerative changes in the retina [28]. In addition, high-grade myopic maculopathy, high-grade lacquer cracks, and choroidal thinning are associated with the development of myopic choroidal neovascularization [29]. Myopic choroidal neovascularization is a particularly frequent cause of vision impairment and blindness in young and working-age populations [30]. It is therefore important to evaluate choroidal changes in highly myopic patients.
In addition to its retrospective study design, our study had some limitations. First, our control group may not have completely represented normal eyes because their mean SE and AL were ŌłÆ2.35 ┬▒ 2.40 and 24.47 ┬▒ 0.95 D, respectively, which indicate mild to moderate myopia. However, the prevalence of myopia in eastern and southeastern Asian countries is increasing [2,3], and we believe that our comparison of mild to moderate myopia and high myopia may meaningfully reflect the actual clinical situation in Korea. Second, we could not identify the exact mechanism underlying the effects of AL elongation on some layers. Some layers may have been more vulnerable to mechanical stretching, but further histopathological studies are needed. Third, we included only patients with high myopia without pathological changes. Because of the structural changes that occur in pathological myopia, there could be several processing errors, including individual retinal layer segmentation. Therefore, including only highly myopic patients without pathologic changes was expected to facilitate more reliable results.
In the superficial capillary vascular complex of the macular area, there were no statistical differences between the NFL of eyes with high myopia and normal eyes. However, the perifoveal area of the GC-IPL was thinner in highly myopic patients. In the deep capillary vascular complex, most of the ETDRS subfields of the INL and OPL were thinner in eyes with high myopia than in normal eyes. In the outer retinal layer, most areas of the ONL were thinner in eyes with high myopia than in normal eyes. However, there were no statistical differences between the RPE and PRL thicknesses. Thinning of the choroid was also observed in highly myopic eyes. In conclusion, thinning of the choroid and retina, especially in most ETDRS subfields of the deep capillary vascular complex, were observed in high myopia without pathologic changes. Additionally, the perifoveal area of the superficial vascular complex and most ETDRS subfields of ONL in the outer retinal layer were also significantly thinner in highly myopic patients than in normal individuals; the thinning may be attributable to myopic elongation of the globe. We hypothesized that the deep capillary vascular complex and the perifoveal area of the superficial capillary vascular complex are more vulnerable to mechanical stretching, whereas the foveal area of the superficial capillary vascular complex and the PRL and PRE of the outer retinal layer were less affected in high myopia without pathologic changes. Overall, we identified structural changes in eyes with high myopia without pathologic features, which may facilitate a better understanding of myopization.

 PDF Links
 PubReader
 ePub Link
 Full text via DOI
 Full text via PMC
 Download Citation
 Print
Print


