

Early detection of glaucoma is essential for maintaining the quality of life by preserving the patient's visual function as long as possible [1,2]. To detect glaucoma earlier, optical coherence tomography (OCT) is widely used by many clinicians, as OCT is thought to be very efficient in detecting retinal nerve fiber layer defects. Clinicians currently depend upon summary metrics. While numerous studies have documented that the metrics show reasonably good sensitivity [3], summary metrics can also miss eyes with clear damage as seen on probability maps [4]. The OCT manufacturers utilize unique software algorithms for their own devices, which are driven by a normative database considering age and sex.
However, as described by previous studies, the normative database can be limited by ethnicity, axial length, and retinal vessel positions. Although taking all variables into account is too difficult, we can compare the variables in a single environment to determine which variable is better to detect glaucomatous changes. In our previous study [5], we showed that the major retinal artery position and the axial length were the two most relevant factors to peaks of the peripapillary retinal nerve fiber layer thickness. However, for a more precise comparison, we needed to develop a new program that could visualize the customized normative database of the retinal nerve fiber layer.
This study assessed the influence of the two major factors (major retinal artery position and axial length) on detecting glaucoma early in a single ethnicity group. The goal was to determine the relationship of each factor to the criteria discordance by considering each factor for glaucoma detection.
Materials and Methods
This study was approved by the institutional review board of CHA Bundang Medical Center (2017-05-045-001) and conducted at CHA Bundang Medical Center. This study conformed to the Declaration of Helsinki and written informed consent was obtained. One hundred and fifty-one healthy eyes of 151 Korean adults (normative group, prospectively enrolled and approved by the institutional review board) and 137 additional eyes (validation group; 79 early-glaucoma eyes of 79 Korean adults and 58 age-matched additional healthy eyes of 58 Korean adults retrospectively enrolled and approved by the institutional review board) were consecutively enrolled between 2015 and 2017. All subjects underwent a full ophthalmic examination including slit-lamp biomicroscopy, best-corrected visual acuity (BCVA), spherical equivalent measurements, Goldmann applanation tonometry by a glaucoma specialist (SR), central corneal thickness (CCT) measurements using an ultrasonic pachymeter (UP-1000; Nidek, Gamagori, Japan), axial-length (AXL) determinations using an Echoscan (US-4000, Nidek), gonioscopy, visual-field tests using static automated white-on-white threshold perimetry (Swedish Interactive Threshold Algorithm standard 24-2, Humphrey Field Analyzer II; Carl Zeiss Meditec, Dublin, CA, USA), fundus examinations after pupil dilation, fundus photography/red-free photography using a fundus camera (VX-10i; Kowa, Nagoya, Japan), and Spectralis OCT scans (Heidelberg Engineering GmbH, Heidelberg, Germany).
The inclusion criteria for all subjects were visual acuity of >20 / 30 and an age between 18 and 80 years. The exclusion criteria were clinical evidence of neuro-ophthalmic disease, retinal disease, history of retinal and refractive surgery within 3 months, or closed irido-corneal angle and refractive error of >┬▒ 8.0 diopters (D) and ┬▒3.0 D of cylinder. In the normal group, subjects were additionally excluded if intraocular pressure (IOP) was > 21 mmHg, a glaucomatous optic disc was present, or abnormal visual-field test results existed. Subjects with mean deviation (MD) values >ŌłÆ6 dB (normal or early field damage) were consecutively enrolled in the validation group.
The retinal nerve fiber layer (RNFL)-defect-detecting ability of the two software programs were assessed based on the standard criterion named ŌĆ£early-glaucoma state.ŌĆØ The early-glaucoma state was defined as subjects showing glaucomatous optic disc contours or RNFL defects in red-free photography plus corresponding abnormal visual-field results with early damage (MD better than ŌłÆ6 dB). A reliable visual field was defined by fixation loss <30% and a false-positive or false-negative error <20%. An abnormal visual field was defined by one or more of the following criteria: glaucoma hemifield test outside normal limits, pattern standard deviation decreased to p < 0.05, and three or more non-edged points in a cluster decreased to p < 0.05 with one of these decreased to p < 0.01 [6].
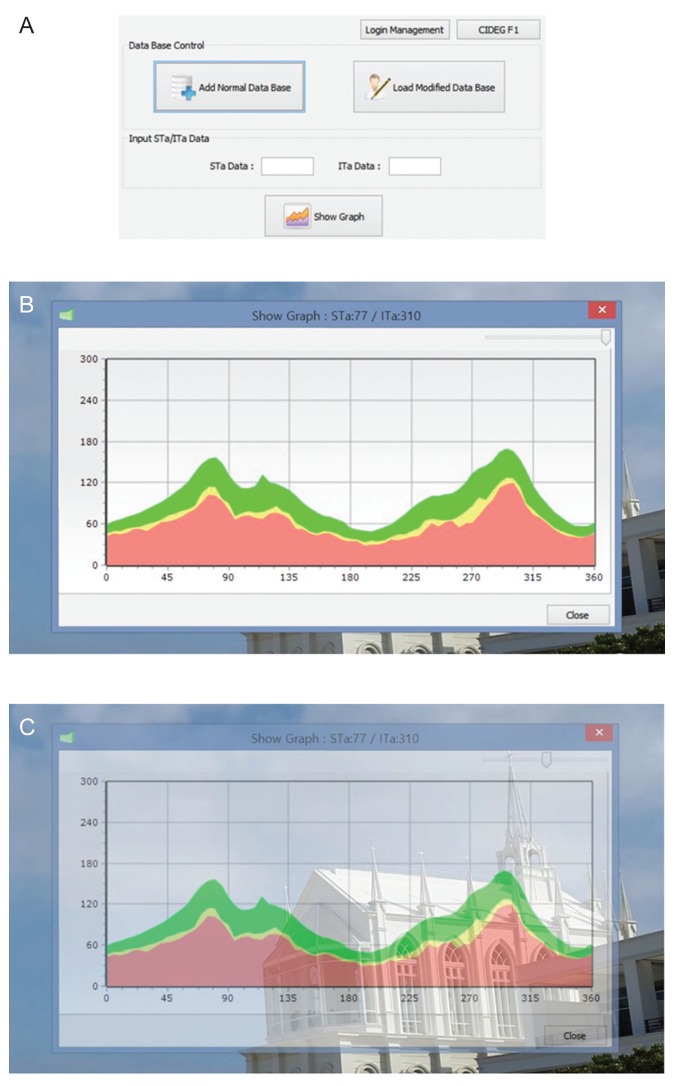
The subjects' temporal-superior-nasal-inferior-temporal (TSNIT) graphs in the validation group were assessed using the built-in software and our custom-built software. If a subject's graph line contacted the reference graph of each software (lower 1% limit of normative data), it was defined as abnormal. The custom-built software displayed four different normative graphs according to the major retinal artery position [5]. Using the overlaying technique in the software, the observer could detect abnormal regions easily (Fig. 1A-1C). The validation group was set to compare the RNFL-defect-detecting ability of three different criteria for the lower 1% limit. Criterion 1 was from the manufacturer's data; criteria 2 and 3 were from the established normative data in 151 healthy Korean eyes driven by their axial length and vessel position, respectively. For criteria 2 and 3, the volunteers' data were separated into four subgroups, which were combinations of two groups according to the median values of axial-length and vessel-position data.
RNFL-thickness measurement and angle assessment
All OCT scans were performed by a highly experienced operator, and image analysis was performed according to the same protocol as described elsewhere [5]. Briefly, the peripapillary RNFL thicknesses were measured using the instrument's built-in software ver. 5.4.7.0. To avoid the Fovea to Disc (FoDi) technology effect, the mode for internal fixation was deactivated because the FoDi technology provides a predicted horizontal fovea to disc axis even in a severely torsioned eye at a baseline scan. This means that the FoDi effect would interfere the measurement of the RNFL peak location. All measurements were automatically segmented and selected images (with quality scores >22) were reconfirmed one by one.
Each subject's RNFL-thickness data at intervals of 5┬░ (a total of 72 values) were extracted using the Cool Ruler software ver. 1.5 (freeware from Fabsoft, http://www.fabsoft.com) from the TSNIT graphs. The cross points in a 3.5-mm peripapillary circle and the major retinal arteries of the superotemporal and inferotemporal halves were designated obtaining the angle degrees between a horizontal line (from the center of the disc) and the cross points. The angle degrees were measured with the PicPick software ver. 3.2.4 (freeware from NTeWORKS, http://www.picpick.org) and ImageJ (National Institutes of Health, Bethesda, MD, USA).
Statistical analysis
Statistical analyses were performed using the IBM SPSS Statistics ver. 21.0 (IBM Corp., Armonk, NY, USA). Chi-square tests and independent sample t-tests were used to compare demographic features. A p-value <0.05 was defined as statistically significant. For comparison between the accuracy of the built-in software and our custom-built software, kappa values were utilized to assess the degree of agreement between the two software programs to identify the early-glaucoma state. The kappa statistic was calculated from a 2-by-2 table in which the results from the two software programs corresponded to that for early-glaucoma diagnoses. Kappa values between 0.0 and 0.2 indicated slight agreement; those between 0.21 and 0.40 indicated fair agreement; those between 0.41 and 0.60 indicated moderate agreement; those between 0.61 and 0.80 indicated good agreement; and those between 0.81 and 1.00 indicated almost perfect agreement. With estimated kappa values of 0.4 and 0.9 for each software's decision from a pilot study, a minimal number of 50 subjects was required to detect a 0.5 difference in kappa values above positive ratings of 0.5 with 90% statistical power [7].
The characteristics of the subjects were statistically analyzed according to whether the software programs have an identical decision from all three criteria (concordance group) or not (discordance) to assess the relationship between different criteria and the early detection ability.
Results
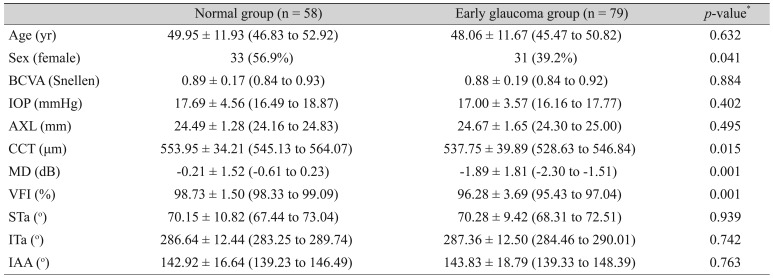
Table 1 shows the percentage of males in the early-glaucoma group that was relatively higher than that of the normal group with marginal statistical significance (p = 0.04). The mean values of CCT, MD, and visual-field index (VFI) in the normal group were higher than those in the early-glaucoma group. BCVA, IOP, AXL, major artery location (STa and ITa) and inter-arterial angle were not statistically different between the normal group and the early-glaucoma group.
Table 2 shows the agreement of the three criteria with the standard diagnosis of early-glaucoma eyes. Kappa values for criterion 3 (╬║ = 0.940, p < 0.001) were highest among the three criteria. However, criterion 2 (╬║ = 0.852, p < 0.001) also showed higher kappa values than criterion 1 (╬║ = 0.475, p < 0.001). The sensitivity and specificity for each criterion are listed in Table 2. Criterion 3 showed the best discriminatory ability, although criterion 2 was also better than criterion 1.
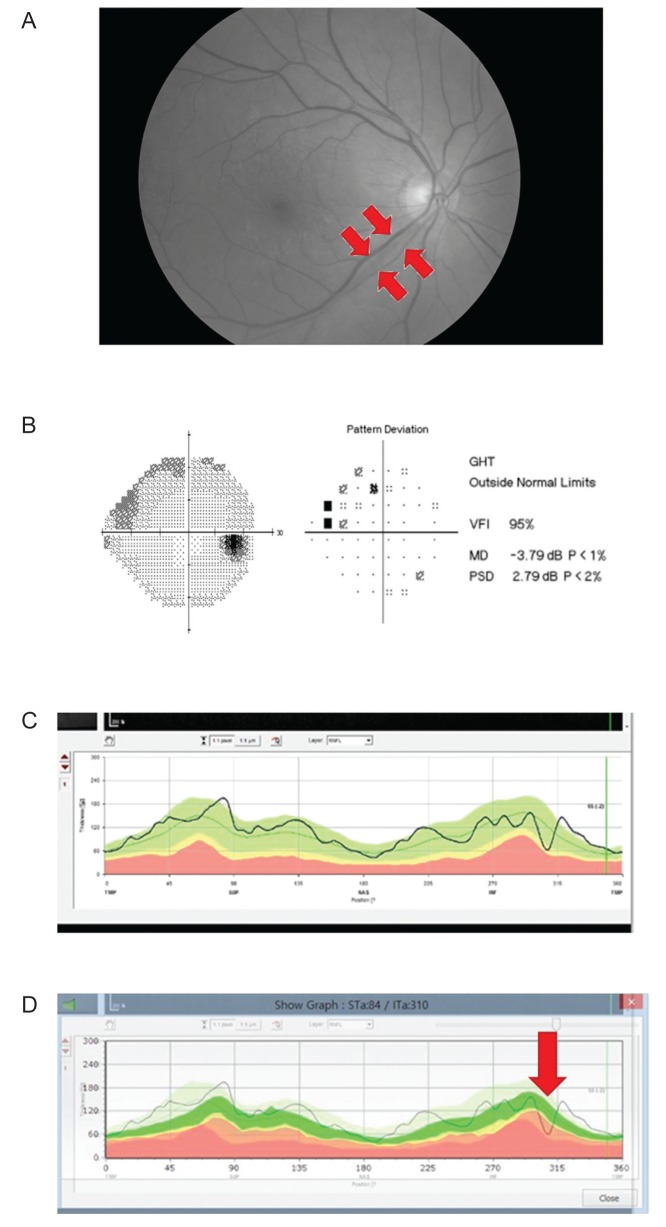
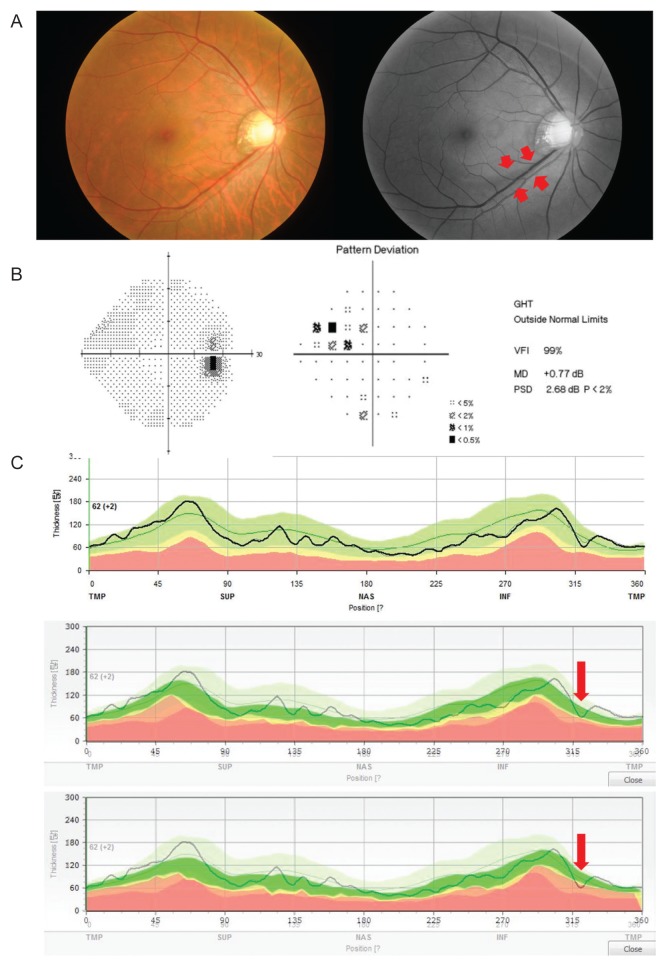
Fig. 1 describes how to utilize the custom-built software. Two representative cases showing a remarkable ability to detect glaucoma early are displayed in Fig. 2A-2D. And the ability to detect early glaucoma can be improved by using the vessel position data (Fig. 3A-3C).
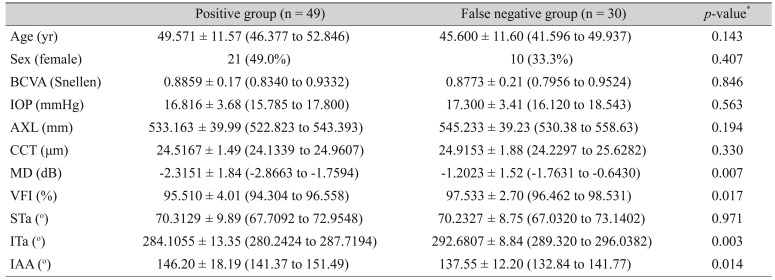
Table 3 shows the demographic characteristics of the positive-OCT group and the false-negative-OCT group. Age, sex, BCVA, IOP, CCT, and AXL were similar in the two groups. However, the MD and VFI of the false-negative eyes in the OCT group were higher than those of the positive eyes, suggesting that more false-positive results were observed in early-glaucoma cases using criterion 1 (manufacturer's database). The ITa was related to the temporalization of vessels in the false-negative group with statistical significance (p = 0.003). However, the STa was not related to the temporalization. This might be also related to the vulnerability difference between the inferior and superior RNFL defects [8].
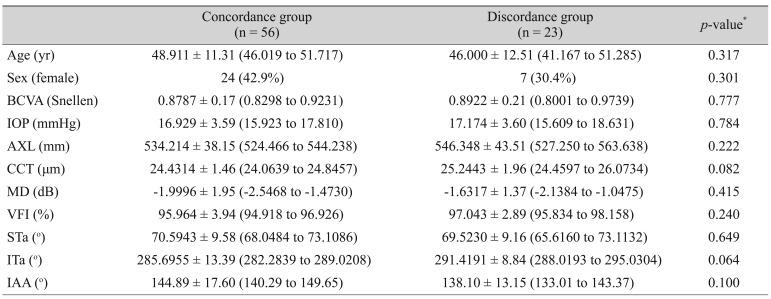
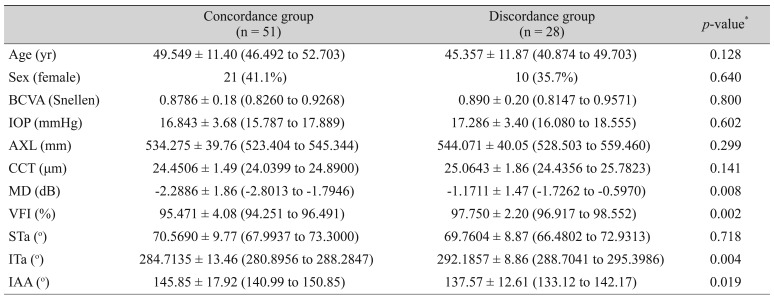
We also compared the concordance of criteria 2 and 3 with criterion 1 in the early-glaucoma group (Table 4, 5). Table 4 shows that there was no factor related to the discordance between criteria 1 and 2. However, discordance was found between criteria 1 and 3, especially for MD, VFI, ITa, and inter-arterial angle. The difference was statistically significant (Table 5) meaning that the STa-adjusted norms were more sensitive for the detection of early RNFL changes than the AXL-adjusted norms.
Discussion
In our study, we have constructed a new reference line for detecting retinal nerve fiber layer defects corrected by retinal vessel location or axial length using our custom-built software. Individual variation of the RNFL thickness obtained using spectral domain OCT is a problem not only for glaucoma specialists but also for patients in terms of their quality of life [2]. In one study, 15% of glaucoma patients were blind during their whole life [9]. Late diagnosis is one of the most important reasons for increasing the risk for blindness [10]. Therefore, if we can detect RNFL defects earlier, we may improve the patient's vision. From our previous study [5], we have confirmed that consideration of the major retinal artery position is helpful for early detection of glaucomatous RNFL defects. However, in clinics, different types and versions of OCT devices or software are used due to a financial or a technical reason. Therefore, clinicians cannot always apply the normative database directly to each patient. Our study was originally designed to overcome this issue using a simple overlaying technique with our developed software. This software can store the normative data of RNFL thicknesses, constructing a large database. With minimal modification, we can then utilize the data from the different types of OCT instruments or software, which means customization can be done per institution or per ethnic population.
Besides the location data of the major retinal vessel, myopia parameters such as axial length and spherical equivalent were significantly correlated to the peak positions of RNFL thickness according to our previous study [5]. Therefore, using the database-constructing function in our software, we could configure variables after accumulating a large database to achieve a better diagnosis. This database program also allowed us to investigate the influence of ethnic differences on RNFL thickness or TSNIT graph contour [11].
Moreover, our software has a very simple but unique function that enables us to get two different graphs superimposed on one screen or monitor. This function shines especially in the real-world practice that is very heterogeneous in terms of the types of monitors and the computer settings. This simple technique enables us not only to detect the RNFL defect in a different set of normative databases but also to use the software in different types of OCT devices (e.g., Cirrus or RTView). With a single placement of a cursor in the software window, we could make the reference graph transparent as necessary (Fig. 1, 2). At first inspection, confusion due to the background color occurred; however, this issue was easily overcome by moving the cursor to optimize the transparency of the reference graph. The inter-user variability and the intra-user variability were checked by two examiners (a glaucoma specialist and a resident). The kappa values were all 1.0, implying that the problem was negligible.
Although the major temporal vessel positions were known to be correlated with the peak of the RNFL [12,13], we found a slight discrepancy between superior and inferior artery locations. Wang et al. [8] reported that peripapillary superior artery positions were significantly nasalized according to glaucoma severity. This is a possible reason for the ITa's statistically significant relationship to temporalization of vessels in the false-negative group. In our study, STa was not significant.
In our previous study, the correlation of RNFL peak location and other factors, such as major retinal artery or vein position, was observed. AXL was evaluated, and we found that the location of the major retinal artery was the factor most correlated with the RNFL peak location. Hood [4] also reported difficulty in interpreting the metrics that each OCT device provided although numerous studies have documented their reasonably good sensitivities (e.g., 80%). If the study included only severe glaucoma cases, then 80% sensitivity would be a serious issue. To prevent this issue, we have included eyes with early glaucomatous changes. Because the major retinal artery location and AXL were the two most relevant factors to the RNFL-thickness data, we have assessed them in this study.
A major limitation of our study was the fundamental feature of indirectly obtained RNFL-thickness data because of the manufacturer's policy. However, as we discussed in another report [5], qualitative and quantitative comparisons have shown the reproducibility error was smaller than the previously reported variation of OCT scans [14]. There were two false-positive cases in criterion 3 with an RNFL defect in the nasal region that generally correlated less to the glaucoma type. We believe that this might be one good reason to have a larger database to allow the utilization of more variables. Although the RNFL-thickness data had to be manually extracted, we uploaded new normal data and visualized this data easily as a graph using our software.
In this study, we utilized only one variable at a time for categorizing the reference graph, which was determined by the median value of the artery positions or AXL values and which produced four graphs. The reason for this was efficiency. We compared the accuracy of this method to that of another method that had four subgroups determined by the bottom quarter, the median, and the top quarter values. There was no significant difference between the two methods (kappa value [95% confidence interval] of methods 1 and 2, 0.980 [0.941 to 1.000] vs. 0.960 [0.905 to 1.000], respectively). Although this study included early-glaucoma eyes for the validation set, in future studies data with pre-perimetric-glaucoma eyes or ocular-hypertensive eyes would be informative. After unification of ethnicity and graph shifting according to retinal artery location, the most remarkable change was the narrowing of the 99% interval. Because the increase of sensitivity can lead to the early detection of glaucoma, more subtle changes can theoretically be detected.
In conclusion, even in early-glaucoma states, the accuracy of RNFL defect-detection can be dramatically improved by considering the uniform ethnic population and the location of the major retinal artery. To achieve that goal, a customized database per institution with a graph-overlaying technique could provide a simple and feasible way for clinical practice.

 PDF Links
 PubReader
 Full text via DOI
 Full text via PMC
 Download Citation
 Print
Print


