

Diabetic retinopathy is one of the most common causes of vision loss in developed countries [1]. The Diabetic Retinopathy Study and Early Treatment Diabetic Retinopathy Study (ETDRS) demonstrated the effectiveness of laser photocoagulation in the treatment of this disease. Panretinal photocoagulation (PRP) has been recommended in eyes with severe non-proliferative diabetic retinopathy (NPDR) and non-high-risk proliferative diabetic retinopathy (PDR) [2,3].
Despite the proven benefit of PRP in stabilizing diabetic retinopathy, it is a deleterious treatment that causes thermal damage and induces photoreceptor loss and retinal pigment epithelium (RPE) hypertrophy [4]. In addition, if the laser intensity is too strong, it can destroy the entire retinal layer, including the ganglion cell layer (GCL). The destruction of ganglion cells can cause a subsequent decrease in peripapillary retinal nerve fiber layer (RNFL) thickness [5].
The pattern scanning laser (PASCAL) system can be used as an alternative to the conventional PRP in retinal photocoagulation. This system can effectively reduce the total pulse energy by shortening the laser pulse duration by using a semi-automated patterned laser [6,7,8]. Thus, there is less thermal diffusion within the retina than with conventional PRP [6]. Typically, frequency-doubled Nd:YAG (532-nm, green) lasers are used because of their high absorption by melanin and hemoglobin at green wavelengths. However, the 577-nm (yellow) wavelength is a preferable alternative to the 532-nm wavelength [9], as the 577-nm laser offers several advantages. Less small-angle scattering in the transparent ocular media is observed [10], and theoretically, reduced scattering allows for better focus on the retina. In addition, it provides greater transmittance through corneal and reticular opacities, making laser delivery more consistent [11].
Several studies have reported the changes in retinal thickness and peripapillary RNFL thickness after conventional PRP or 532-nm PASCAL photocoagulation [12,13,14]. However, there is little information on the changes that occur after 577-nm PASCAL photocoagulation. To the best of the authors' knowledge, this is the first study to examine the effects of 577-nm PASCAL photocoagulation. In addition, optical coherence tomography (OCT) imaging with computerized segmentation algorithms of the intraretinal layers were able to calculate the thickness of individual layers of the retina. Therefore, each retinal layer of the macula could be identified and its thickness could be quantified. This study examined the changes in the thickness of each macular retinal layer, RNFL thickness, and central macular thickness (CMT) over a one-year period following 577-nm PASCAL photocoagulation.
Materials and Methods
The medical records of patients with diabetic retinopathy were reviewed retrospectively. The study design followed the tenets of the Declaration of Helsinki for biomedical research and was approved by the institutional review board of Konyang University of Korea (2016-10-002).
Subjects
The participants were patients who visited Konyang University Hospital from May 2013 to June 2015 and were diagnosed with severe NPDR or non-high-risk PDR without macular edema. They were followed up for one year after PRP. Thirty-three eyes from 33 patients with diabetic retinopathy were included.
Patients were excluded if they had the following: a history of vitrectomy, PRP, or intravitreal injection; a history of retinal disease other than diabetic retinopathy; intraocular pressure Ōēź22 mmHg or treatment for glaucoma; a spherical equivalent greater than ┬▒6.0 diopters; and other ocular diseases that could result in a poor OCT signal.
Procedures
The patients underwent complete ophthalmologic examinations, which included best-corrected visual acuity (BCVA), intraocular pressure measurements, slit-lamp biomicroscopic examination, fundus examination, Spectralis OCT system (Heidelberg Engineering, Heidelberg, Germany), and fluorescein angiography (Spectralis Heidelberg Retina Angiograph+OCT, Heidelberg Engineering)
Pattern scanning laser photocoagulation
The PASCAL Streamline 577 photocoagulator (Topcon Medical Laser Systems, Livermore, CA, USA) was the 577-nm laser system used in this study. A total of 3,438.3 ┬▒ 421.1 (range, 3,050 to 4,120) laser spots were applied to the peripheral retina using a fundus contact lens (Superquad 160; Volk Optical, Mentor, OH, USA). PASCAL photocoagulation was performed over the course of two sessions at an interval of one or two weeks. A laser spot size of 200 ┬Ąm, a spot distance of 0.5 spot size (100 ┬Ąm), and a pulse duration of 20 ms were used. The laser strength was increased from 250 mW to produce gray-white burns. Sixteen spots in a 4 ├Ś 4-square grid pattern were applied simultaneously to the superior or inferior retina in a rapid consecutive raster.
Optical coherence tomography
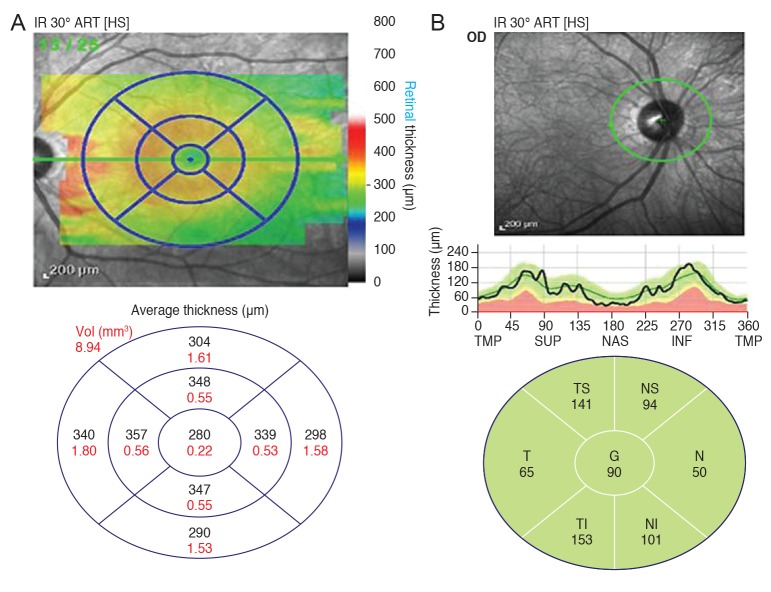
The technique for computerized intraretinal segmentation of the Spectralis OCT device was performed to identify the thickness of each retinal layer. This segmentationwas performed in 25 horizontal scans separated by 240 ┬Ąm. The macular thickness (┬Ąm) and the volume (┬Ąm3) of the retinal layers were obtained automatically in a circular area centered on the fovea with a central circle (1-mm diameter), parafoveal ring (3-mm diameter), and perifoveal ring (6-mm diameter). The parafoveal ring and perifoveal ring were divided into superior, temporal, inferior, and nasal quadrants corresponding to the nine regions of the ETDRS map (Fig. 1A)
The Axonal Analytics feature of the Spectralis OCT device was also used to measure the peripapillary RNFL thickness. Using this instrument, the RNFL thickness was measured around the disc with consecutive circular Bscans (diameter of 3.5 mm, 768 A-scans). The parameters that were registered included the global and sector thicknesses (superonasal, nasal, inferonasal, inferotemporal, temporal, and superotemporal) (Fig. 1B).
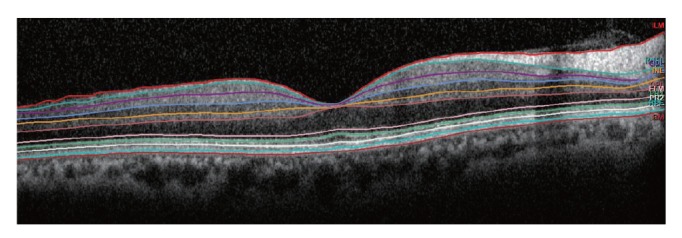
Segmentation of each retinal layer using the 25 horizontal foveal scans was performed automatically by the new segmentation application (Segmentation Technology, Heidelberg Engineering). The retina was separated automatically into ten layers: 1 = inner limiting membrane (ILM), 2 = RNFL, 3 = GCL, 4 = inner plexiform layer (IPL), 5 = inner nuclear layer (INL), 6 = outer plexiform layer (OPL), 7 = external limiting membrane (ELM), 8 = Photoreceptor, 9 = RPE, 10 = Bruch's membrane (BM) (Fig. 2). The RNFL thickness was from the ILM to the RNFL. As such, the GCL thickness was from the RNFL to GCL; the IPL thickness was from the GCL to IPL; the INL thickness was from the IPL to the INL; the OPL thickness was from the INL to the OPL; the outer nuclear layer (ONL) thickness was from the OPL to the ELM; the RPE thickness was from the RPE to the BM; the inner retinal layer (IRL) thickness was from the ILM to the ELM; and the photoreceptors thickness was from the ELM to the BM. The mean thickness was calculated for each of the retinal layer thicknesses in the nine regions of the ETDRS map.
The macular thickness was measured using three concentric circles created by the perifoveal and parafoveal rings with diameters of 1, 3, and 6 mm. The CMT was defined as a 1 mm concentric circle.
The Spectralis OCT uses a blue quality bar with a score ranging from 0 (poor quality) to 40 (excellent quality). Only those images that scored higher than 30 were analyzed. OCT was performed before PRP and at 1, 6, and 12 months after 577-nm PASCAL photocoagulation. The Heidelberg Eye Explorer software ver. 1.8.6.0 (Heidelberg Engineering) was used for OCT image analysis.
Statistical analysis
Repeated-measures analysis of the variance corrected by the Bonferroni method was used to compare the retinal layer thicknesses, peripapillary RNFL thickness, CMT, and BCVA during the follow-up period. Snellen visual acuity measurements were converted to the logarithm of the minimum angle of resolution (logMAR) to simplify the statistical analysis. Statistical analyses were conducted using the PASW Statistics ver. 18.0 (SPSS Inc., Chicago, IL, USA). A p-value <0.05 was considered significant.
Results
Study inclusions and demographics
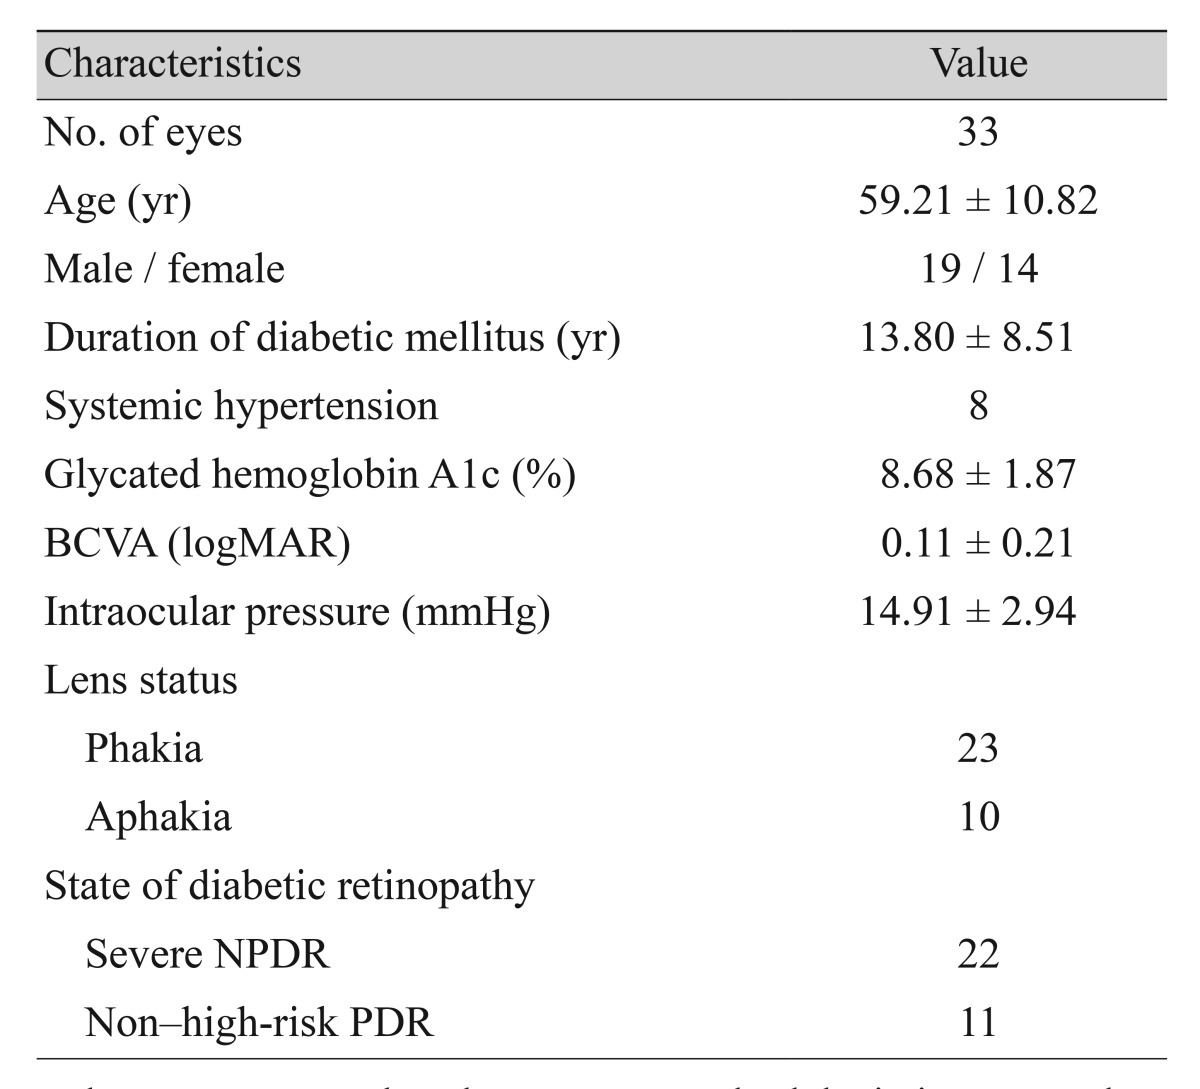
The study included a total of 33 eyes from 33 patients who underwent 577-nm PASCAL photocoagulation. Mean baseline age ranged from 45 to 72 years. Table 1 lists the demographic and clinical characteristics of the patients
Changes in the thickness of each macular retinal layer
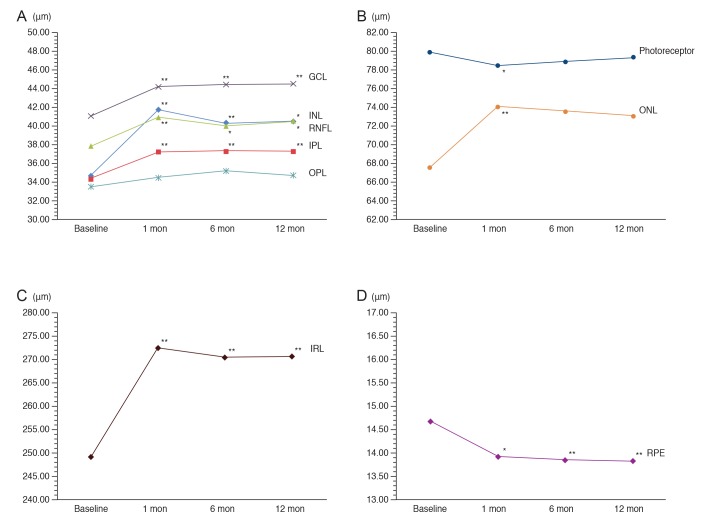
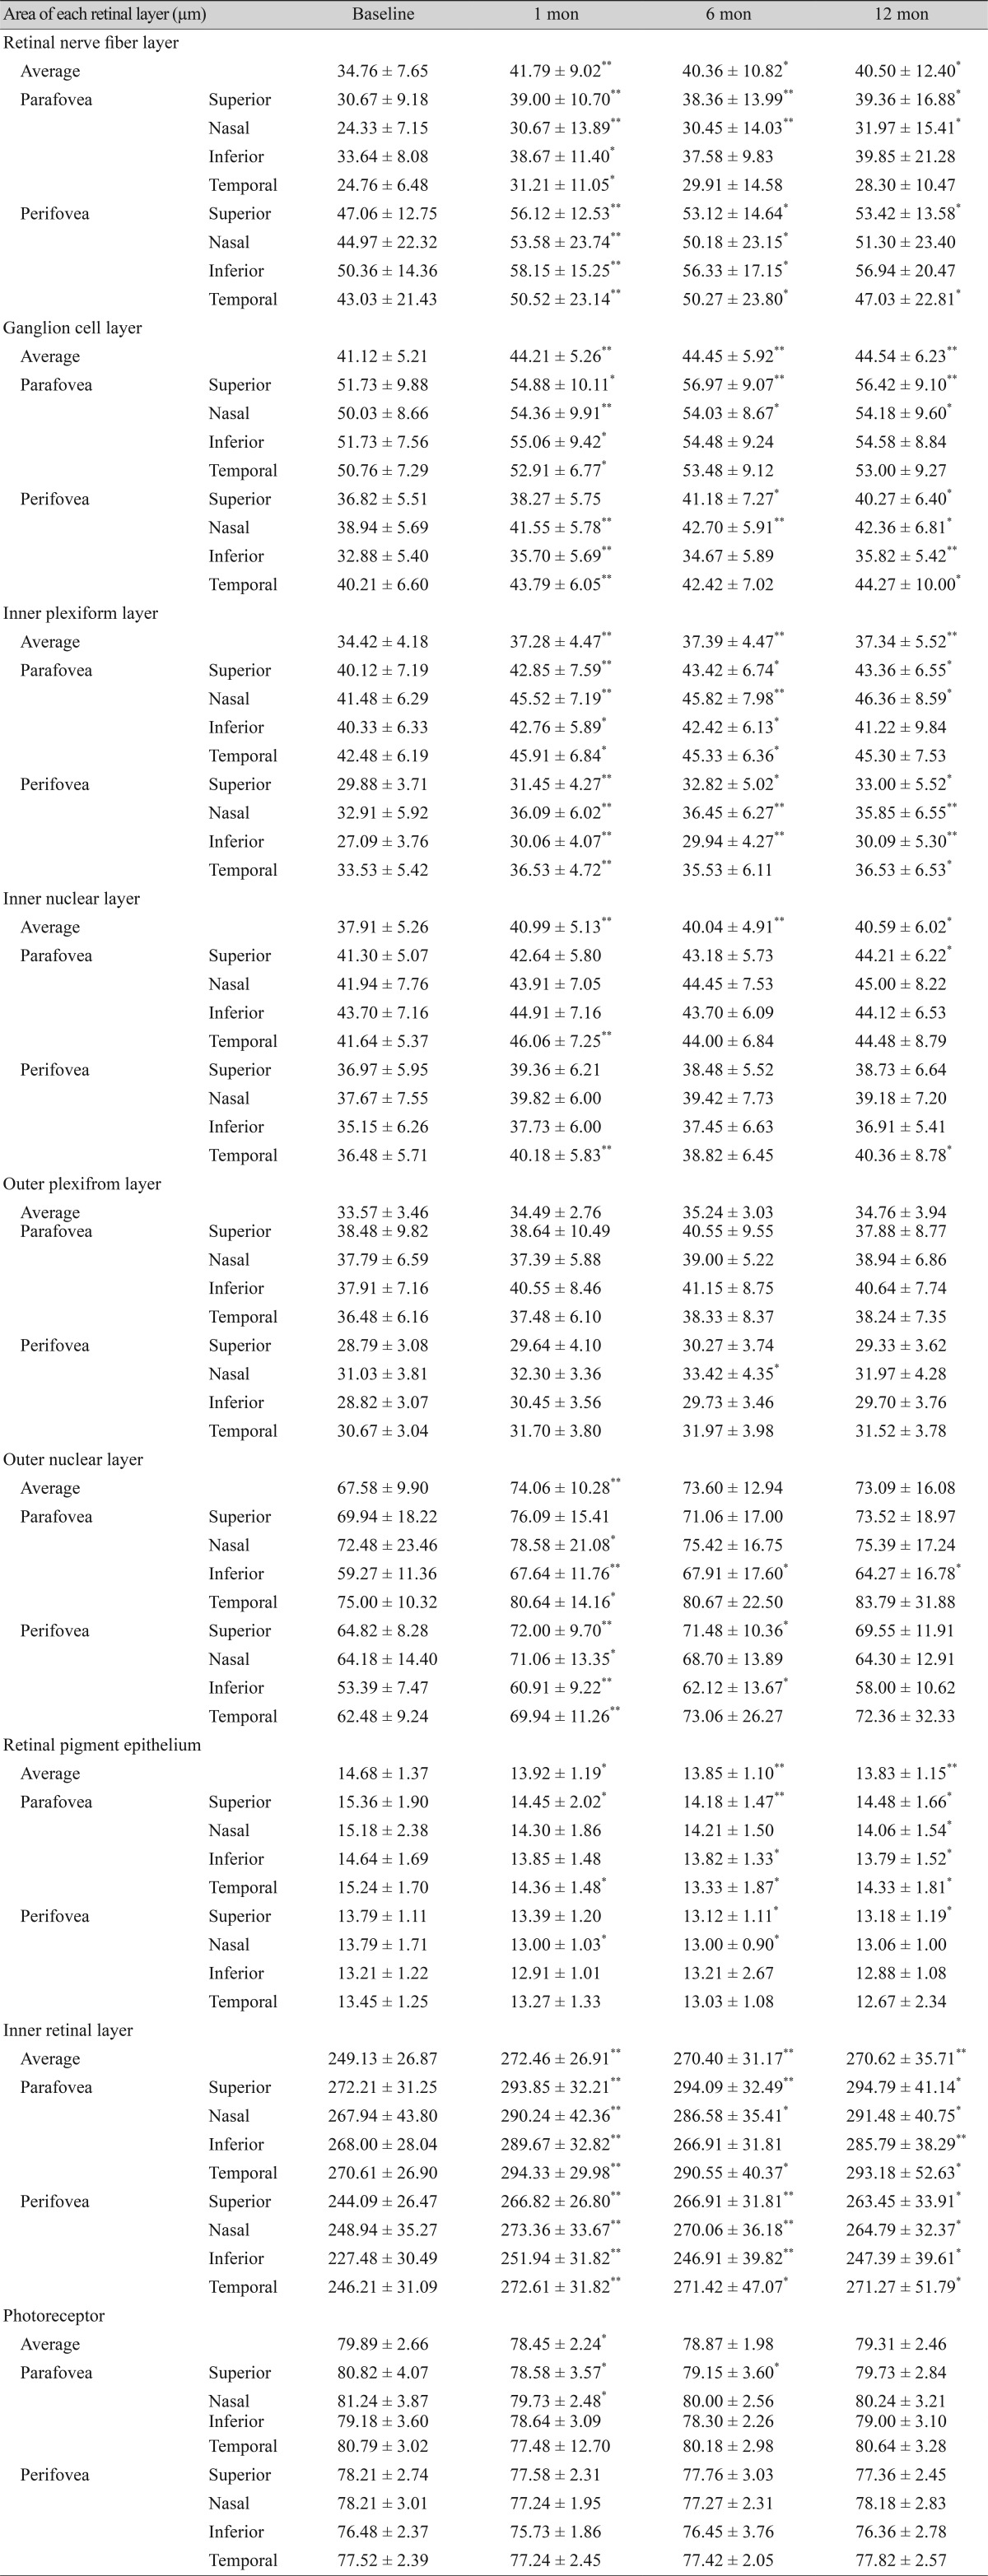
The average thickness of the RNFL, GCL, IPL and INL at each follow-up increased signifcantly from baseline (Fig. 3A). The average thickness of the photoreceptor layer at one and six months post-PRP decreased signifcantly from baseline, but there were no signifcant changes at
Twelve months post-PRP compared to baseline (Fig. 3B). In addition, the average thickness of the IRL at each follow-up increased signifcantly from baseline, whereas that of the RPE decreased signifcantly from baseline (Fig. 3C, 3D). The mean thickness of the OPL increased slightly at each follow-up compared to the baseline thickness, but these changes were not statistically significant (Fig. 3A). The mean thickness of the ONL increased significantly at 1 month post-PRP compared to baseline and recovered partially thereafter. There were no significant changes at six and 12 months post-PRP compared to baseline (Fig. 3B).
We evaluated the thickness of each macular retinal layer using the nine regions of the ETDRS map. Compared to baseline, the RNFL thickness at 12 months post-PRP increased significantly in the superior, nasal and inferior regions of the parafoveal ring and in the superior and temporal regions of the perifoveal ring. In this way, the GCL thickness increased significantly in superior, nasal and inferior regions of the parafoveal ring and in all regions of the perifoveal ring. IPL thickness increased significantly in the superior and nasal regions of the parafoveal ring and in all regions of the perifoveal ring. INL thickness increased significantly in the superior region of the parafoveal ring. ONL thickness increased significantly in the inferior region of the parafoveal ring and in the temporal region of the perifoveal ring. RPE thickness decreased significantly in all regions of parafoveal ring and in the superior region of the perifoveal ring. IRL thickness increased significantly in all regions of the parafoveal and perifoveal rings. Fig. 3 and Table 2 present the longitudinal changes in the average thickness of each retinal layer.
Changes in peripapillary RNFL thickness and CMT
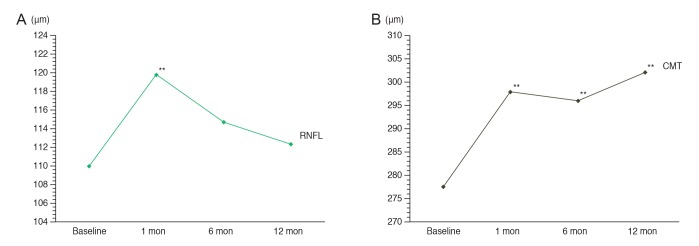
The average thickness of the peripapillary RNFL increased significantly by 9.81 ┬Ąm at 1 month post-PRP compared to the baseline thickness. On the other hand, the peripapillary RNFL thickness recovered partially after one month with no significant changes at 6 and 12 months compared to baseline. There were no significant differences in any quadrant of the global and sector thicknesses (superonasal, nasal, inferonasal, inferotemporal, temporal, and superotemporal) of the peripapillary RNFL. The average CMT at each follow-up increased significantly from baseline. Fig. 4 and Table 3 show the longitudinal changes in the average peripapillary RNFL thickness and in CMT.
Discussion
Several studies have reported the changes in macular retinal layer thickness and peripapillary RNFL thickness after conventional PRP or 532-nm PASCAL photocoagulation in patients with diabetes. Kim et al. [12] reported that the macular GCL, IPL, and peripapillary RNFL thickness increased throughout the one-year post-conventional PRP period. Park and Jee [13] reported that the RNFL thickness in the 532-nm PASCAL system group did not show a significant difference one year after PRP, whereas that of the conventional PRP group decreased significantly. Lee et al. [14] reported that 532-nm PASCAL photocoagulation may not cause a significant change in the peripapillary RNFL thickness, CMT, or optic nerve morphology in patients with diabetic retinopathy. On the other hand, few studies have reported the changes in thickness of each macular retinal layer and in the peripapillary RNFL thickness after 577-nm PASCAL photocoagulation. Therefore, this study evaluated the changes in the thickness of each macular retinal layer, the RNFL thickness, and the CMT for one year after 577-nm PASCAL photocoagulation.
Although PRP has been proven to be an effective treatment strategy for severe diabetic retinopathy, most ophthalmologists agree that the laser intensity causes damage to the entire retinal layer and should be avoided [15]. If the high-intensity laser beam causes the destruction of the entire retinal layer, including the GCL, it will result in a loss of RNFL and cause a sequential decrease in the RNFL thickness [3,13]. In addition, PRP-induced retinal inflammation and macular edema can occur because PRP increases retinal vascular permeability due to the accumulation of leukocytes [16]. The PASCAL system is a semi-autocoagulator that reduces the pulse duration to achieve a rapid consecutive raster with a pattern array. Thus, the system uses short pulse durations of 20 to 30 ms accompanied by a significantly greater power [17]. Because the short laser exposure is limited to the RPE and photoreceptors, the width and axial extent of the retinal lesions are smaller than at longer durations. Therefore, in our study, the PASCAL system caused less damage to the nerve fiber layer by spatially confining the lesion and decreasing the axial spreading of heat toward the inner retinal layer [7]. In addition, less collateral damage was observed with PASCAL photocoagulation compared to conventional PRP while still producing a similar regression of diabetic retinopathy [7,18].
Furthermore, 577-nm PASCAL photocoagulation was less affected by small-angle scattering in the transparent ocular media [10]. This is because a reduced scattering laser theoretically enables better focus on the retina. PASCAL photocoagulation also provides greater transmittance through corneal and reticular opacities, making laser delivery more consistent. Therefore, it was hypothesized that 577-nm PASCAL photocoagulation causes less retinal inflammation, macular edema, and less damage to the nerve fiber layer. In this study, however, each macular retinal layer and CMT had a tendency to increase throughout the 1-year post 577-nm PASCAL photocoagulation period, whereas the average thickness of RPE decreased at 1-year follow-up compared to baseline. This thickening of each macular retinal layer and CMT could be explained by PRP-induced retinal inflammation and edema in the early post-PRP phase. Previous studies have reported an increase in vascular endothelial growth factor after photocoagulation, which enhanced vascular permeability [19,20]. This increase was attributed to mild intraretinal inflammation subsequent to the thermal spread of the laser, despite it having a shorter pulse duration than conventional PRP. On the other hand, the average RPE thickness was lower at the 1-year follow-up compared to baseline. 577-nm PASCAL photocoagulation has a combination of short exposure time with a higher energy level, resulting in shallower and narrower scars in the pigment epithelium. In addition, the combined absorption by both melanin and oxyhemoglobin of the 577-nm wavelength causes less scattering compared to the 532-nm wavelength, allowing for more selective treatment and compensating for the reduction in absorption by RPE melanin compared to 532-nm treatment [21]. The change in RPE thickness was attributed to the features of 577-nm PASCAL photocoagulation.
Using the measurement results of each macular retinal layer according to area via the ETDRS map, it hard to find any meaningful outcomes. This is because every region that showed significant differences was dissimilar in each layer. Retinal thickness increased in all areas when the average thickness increased. However, the retinal thickness also decreased in all areas when the average thickness decreased. As a result, there were no significant regional differences.
In the present study, an increase in the average peripapillary RNFL thickness was observed at the short-term follow-up, while recovery was observed at the long-term follow-up. Muqit et al. [22] reported that conventional PRP may increase the RNFL thickness in the short term with progressive thinning of the nerve fiber layer in the long term. They reported that the thermal rise and spread associated with a longer pulse duration induces intraretinal inflammation, which can lead to macular edema and inner retinal axonal damage. Such sub-lethal damage causes a disruption of the mid-axonal flow and may increase the RNFL thickness in the short term due to laser-induced axonal injury and axonal edema. With time, axonal edema and direct damage induced by the laser treatment can cause axonal cell death and progressive thinning of the nerve fiber layer. Lee et al. [23] reported that the peripapillary RNFL thickness increased at six months after conventional PRP and then decreased at 24 months when compared to baseline. On the other hand, in the 532-nm PASCAL system, Park and Jee [13] and Lee et al. [14] reported that the RNFL thickness may not cause significant change to the peripapillary RNFL in patients with diabetic retinopathy. In this study, although an increase in the peripapillary RNFL thickness was observed one month after 577-nm PASCAL photocoagulation, there were no significant changes at one-year follow-up compared to baseline. This may be associated with a shorter laser exposure time and better focusing on the retina.
This study had several limitations. First, this study had a retrospective and non-randomized design, which creates the possibility of selection bias. Second, this study had a small sample size and relatively short-term follow-up period. Therefore, it is difficult to distinguish the differences in each macular retinal layer and peripapillary RNFL thickness at each follow-up period. In addition, although this study followed the subjects for one year, further evaluation with a long-term follow-up will be necessary to determining if there is atrophy of each macular retinal layer and peripapillary RNFL beyond a one-year period. Third, this study did not include a control group that did not undergo PRP, as creating this control group would raise ethical issues.
In conclusion, the thickness of each macular retinal layer and CMT had a tendency to increase throughout the one-year post 577-nm PASCAL photocoagulation period, whereas the average thickness of the RPE decreased at the one-year follow-up compared to the baseline. Although an increase in peripapillary RNFL thickness was observed one month after 577-nm PASCAL photocoagulation, there was no significant change at the one-year follow-up compared to baseline.

 PDF Links
 PubReader
 Full text via DOI
 Full text via PMC
 Download Citation
 Print
Print


