


Although human body is symmetrical, lateral dominances are observed in several parts of the body. Likewise, ocular dominance is defined as a consistent preference or advantage for using one of the two eyes [1]. The lateral dominance of eye may not seem to be apparent like in the hands or legs. Although ocular dominance is not very noticeable in daily life, the lateral dominance is quite distinctively distributed to one side when tested.
Recent studies have suggested that the visual system exhibit functional and structural asymmetries according to the ocular dominance [2-4]. Functional magnetic resonance imaging (MRI) and visual evoked potentials suggest that the ocular dominance is correlated with the functional asymmetry of the brains [4]. A larger degree of activation in both occipital lobes on functional MRI was noted when the dominant eye was stimulated compared with the other eye, based on sighting and sensory dominance [5,6]. In association with ocular dominance, structural asymmetries of retinal nerve fiber layer (RNFL) as well as the ganglion cell-inner plexiform layer have been found [3]. Moreover, macula area processed in the contralateral hemisphere was thicker in dominant eyes compared with nondominant eyes [2]. The underlying mechanism in ocular dominance involves the imbalances in gamma-aminobutyric acid (GABA) levels in the human visual cortex [7]. These evidences suggest a possibility of reciprocal feedback mechanism related to ocular dominance in the visual cortex and retina.
With technological advancement, recent studies using MRI and optical coherence tomography (OCT) has shown definitively that retrograde transneuronal degeneration actually occur, both following congenital/neonatal brain lesions and those acquired as an adult [8]. In patients with cerebral infarction [9], Parkinson’s disease [10], and Alzheimer’s disease [11], thinning of the RNFL has been observed. Glaucoma is a progressive optic neuropathy with characteristic optic nerve damage and visual field defect. Although the pathophysiological mechanism associated with progression of the disease is still under investigation, it is suggested that the mechanical change in lamina cribrosa causes deficiency in retrograde and anterograde axonal transport of neurotrophins at the level of the optic nerve head [12]. The pathology of glaucoma involves lateral geniculate nucleus, primary visual cortex, as well as the retina and optic nerve head [13].
Glaucoma patients often accompany visual field defects, the location of which differs between the eyes, resulting in an intact binocular visual field [14]. In this regard, it has been hypothesized that the brain may have some central modulation of glaucomatous degeneration in late stage of chronic glaucoma, conserving binocular field [15].
Considering that ocular dominance is associated with the asymmetry of retina as well as of visual cortex and glaucoma pathogenesis involves anterograde and retrograde degeneration of retinal ganglion cells, it is assumed that glaucoma is associated with the ocular dominance. Despite the possible association, the ocular dominance characteristics have not been much studied in glaucomatous eyes.
In this study, we aim to investigate the characteristics and distribution of ocular dominance in glaucomatous eyes. In addition, we tried to catch any trend of ocular dominance according to the progression of glaucoma.
Materials and Methods
Ethics statement
The study protocol was approved by the Institutional Review/Ethics Boards of St. Vincent’s Hospital, The Catholic University of Korea, Suwon, Korea (No. VC16QISI0054). All procedures were performed according to the tenets of the Declaration of Helsinki. The need for written informed consent from the participants was waived, because of the retrospective design of this paper.
Study subjects
This is a cross-sectional study, in which patients have bilateral open-angle glaucoma (OAG) who underwent dominant eye testing at St. Vincent’s Hospital, College of Medicine, The Catholic University of Korea. Data were collected from March 1, 2016 to September 30, 2016.
At the initial examination, all participant’s underwent a review of his/her medical history and a complete ophthalmic examination, including slit-lamp examination, measurement of visual acuity, intraocular pressure by Goldmann applanation tonometry, central corneal thickness, gonioscopy, red-free RNFL photography (CF-60UD; Canon, Tokyo, Japan), standard automated perimetry (SAP) using the 24-2 SITA program (Humphrey Visual Field analyzer; Carl Zeiss Meditec, Dublin, CA, USA), and OCT (Cirrus OCT; Carl Zeiss Meditec).
Inclusion criteria were having bilateral OAG, normal anterior chamber with open-angle on slit-lamp and gonioscopic examination, best-corrected visual acuity of 20 / 30 or better, spherical equivalent within ±10 diopters, and more than two results of visual field (VF) tests. Exclusion criteria were having a history of ocular trauma, having intraocular surgery in either eyes with exceptions of uncomplicated phacoemulsification, or having neurological disease that can affect the measurement of OCT or VF examination, or having other ophthalmologic disease. Patients who showed unreliable VF results (the criteria for which was defined as >25% false-negative results, >25% false-positive results, or >20% fixation losses) were excluded and both eyes of the patient had to meet the above criteria to be part of this study. Glaucoma was defined as the presence of glaucomatous optic neuropathy (i.e., diffuse or focal thinning of the neuroretinal rim or peripapillary hemorrhage) in association with a typical, reproducible VF defect on SAP. A glaucomatous VF was defined by a glaucoma hemifield test result outside of the normal limits and the presence of at least three contiguous points in the pattern deviation plot with p-values <0.05, at least one of which had a p-value <0.01, on two consecutive reliable SAP examinations [16].
Ocular dominance test
Patient’s dominant eye was determined by “the hole-in-a-card” test. The subjects were to hold on to a card with a hole in the center with two hands with their both arms straight and to look at a certain target that is on a board 6 m away. The subject’s eyes are occluded alternatively to find out which eye is aligned with the target when the other eye is occluded. Then, the subject was asked to bring the card toward his or her face without losing the target in the hole until it hits one’s eye. The eye that meets the card hole was determined to be the dominant eye. This process was repeated three times and only repeated results were selected as the dominant eye.
Better eye versus worse eye and Glaucoma severity based on the worse eye mean deviation
Of the two eyes of one subject, the eye that had lower decibel of mean deviation (MD) was considered to be the “worse eye” in our study. The determination of glaucoma severity was based on the MD measurements of worse eye and was categorized into “very early” (MD ≥−3 dB), “early” (MD ≥−6 dB), “ moderate” (MD ≥−12 dB), and “advanced” glaucoma (MD <−12 dB), modified from the Hodapp-Parrish-Anderson grading scale [17].
Patient grouping according to dominant eye choice
Based on the determination of the dominant eye through the hole-in-a-card test and the results from VF results, the proportions of patients who chose their better eye as their dominant eye and those who chose their worse eye as their dominant eye were analyzed according to the glaucoma severity.
Sectoral analyses of structure and functional parameters
All participants were to measure the optic-disc scan, a macular scan to achieve retinal nerve fiber layer thickness (RNFLT) and ganglion cell-inner plexiform layer thickness (GCIPLT) measurements. Twelve clock-hour sectors and average RNFLT and average GCIPLT were measured, and average cup to disc ratios were automatically calculated. Only the results with signal strength of greater than 6 / 10 were used.
VF sectoral MD scores and corresponding RNFLT values were analyzed and compared between dominant eyes versus nondominant eyes in “early,” “moderate,” and “advanced” glaucoma subgroups. To calculate the mean total deviation (TD) of each sector, the decibel level in each location of the TD field, was converted to a linear scale before averaging the data within each sector, and then the averaged data were converted back to decibel units. Of the 54 VF points, two points that correspond to the blind point (optic disc) are excluded. The mean TD superior area was defined as the average of 26 dots in the superior of the horizontal axis and the mean TD of inferior area as the average of 26 dots in the inferior of the horizontal axis. When RNFLT was measured with OCT, the results were given in 12 clock-hour segment. In previous study, 4 and 9 o’clock segments did not represent VF sensitivity, so the two segment values were excluded [18]. Therefore, superior RNFLT was defined as the average of 10, 11, 12, 1, 2, and 3 clock-hour values. Likewise, inferior RNFLT was defined as the average of 5, 6, 7, and 8 clock-hour values [19]. The mean TD of the central cluster VF was defined as the average of 12 central data points, whereas the mean TD of the peripheral cluster VF was defined as the average of 40 peripheral data points [19].
Data analysis
Structure and functional comparisons were made between dominant eyes versus nondominant eyes using paired t-test. Since the data was paired, logistic regression analyses were used to identify parameters associated with ocular dominance [2]. First, we adjusted for confounders that showed differences of borderline significances (p < 0.25) in univariate analyses (model 1). In model 2, we adjusted for the same confounders except average RNFLT and average GCIPLT, because the factors showed significant correlation with each other. Chi-square analyses were used to compare the groups in terms of categorical variables. Bonferroni correction was applied in multiple comparisons. All statistical analysis was made via IBM SPSS ver. 26.0 (IBM Corp., Armonk, NY, USA). The statistical significance was determined at p < 0.05 in all analysis.
Results
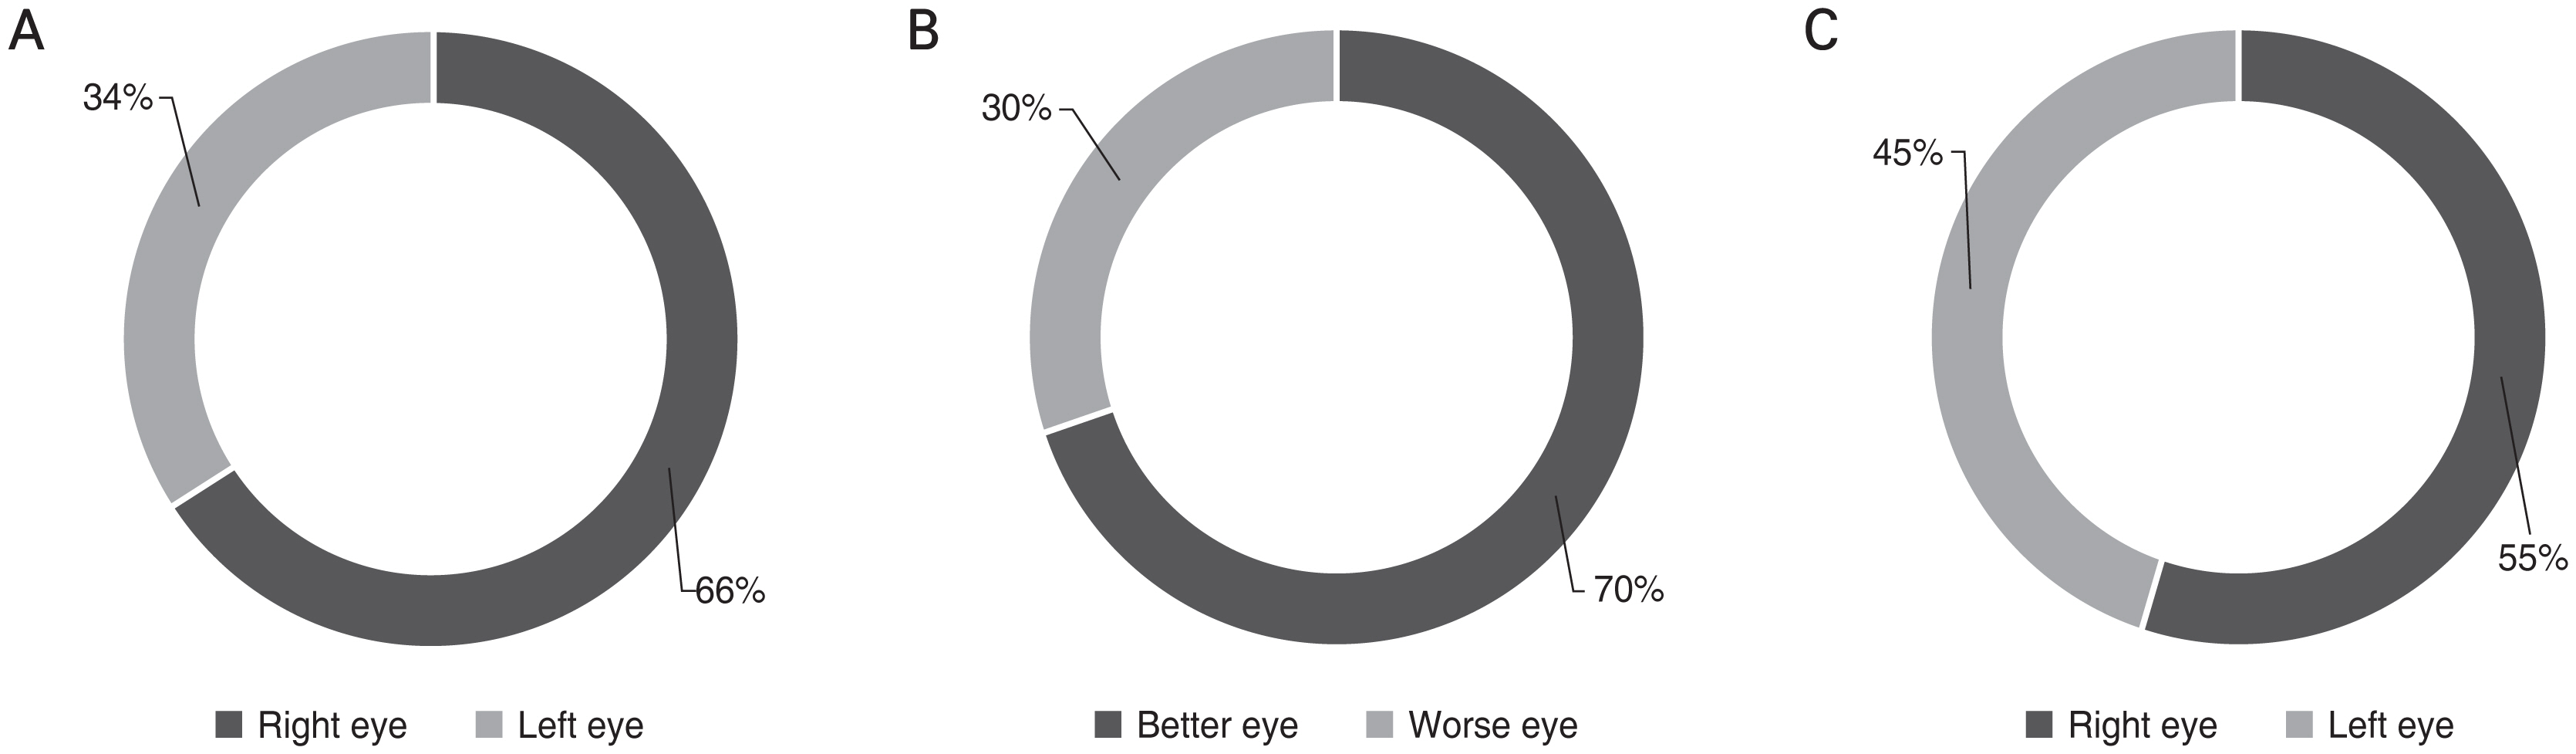
A total of 200 bilateral OAG eyes were enrolled. Of the 200 subjects 113 were male patients and 87 were female patients (Table 1). Mean age of the participants was 57.5 ± 13.9 years old. MD of the better eye was −4.24 ± 5.33 dB and MD of the worse eye was −10.4 ± 7.09 dB. Fig. 1 shows the distribution of ocular dominance in our study population. Among the subjects, 60% had the right eye as their dominant eye, and 70% of the subjects had their better eye as their dominant eye (p < 0.001, all chi-square test) (Fig. 1A, 1B). However, the proportion of better eye was not significantly different between right and left eyes (p = 0.171) (Fig 1C).
Table 2 shows the results of conditional logistic regression analyses regarding the ocular factors on the determination of ocular dominance. In the univariate analyses, right eye, thicker corneal thickness, lower number of antiglaucoma eye drops, better MD and thicker average RNFLT, and GCIPLT were significantly associated with ocular dominance (all p < 0.05). In the multivariate analyses, right eye and better MD were remained to be significantly associated with ocular dominance (all p < 0.001).
Ocular dominance tended to be on the better eye, and this trend was more apparent as the severity of glaucoma increased (p = 0.035, chi-square test) (Fig. 2A). In contrast, regardless of glaucoma severity, ocular dominance tended to be on the right eye (p = 0.450, chi-square test). However, in advanced glaucoma, the ratio of ocular dominance on the left eye was higher compared to other stages of glaucoma, although still less than the absolute number of ocular dominance on the right eye (Fig. 2B).
In Tables 3, 4, intereye comparisons of dominant versus nondominant eyes in terms of VF indices and structural indices respectively according to glaucoma severity are shown. The differences between dominant and non-dominant eyes became statically significant in moderate glaucoma and more significant in advanced glaucoma in both VF indices and RNFLT comparisons, whereas it was not as apparent in early glaucoma (Tables 3, 4).
Discussion
In this study, we tried to investigate the distribution and characteristics of ocular dominance in eyes with glaucoma. Our results clearly showed that in glaucomatous eyes, ocular dominance was more often positioned in the right eye and in the better eye in terms of glaucomatous damage.
Right eye dominance is consistent with the previous studies of the laterality of the ocular dominance [2,20]. It is known that approximately two-thirds of the population is right-eye dominant and one-third is left-eye dominant [2]. Interestingly, the right eye dominance was persistent with the different stages of the glaucoma. This suggests that right eye dominance, like right handedness, shows strong propensity of lateral dominance.
Intriguingly, the position of ocular dominance showed differential relationship according to the severity of glaucoma. In sectoral analyses, nondominant eyes exhibited significantly worse functional and structural glaucomatous changes in every sector compared with dominant eyes especially in moderate advanced glaucoma, whereas in early glaucoma, significant differences were found only in the central sector. Moreover, intereye difference between non-dominant and dominant eyes was significantly increased with the severity of glaucoma.
The underlying mechanism explaining the association between glaucoma severity and ocular dominance is not clear. One possible mechanism addressing this association is that eyes with ocular dominance may change as the progression of glaucoma. In the past, ocular dominance was thought to be fixed once it was determined [1]. However recent research suggest that the preference of visual input can change due to different reasons such as size of a perceived visual image or modulation of hand use [21]. For example, the ocular dominance may shift from the original position into the better eyes as the glaucoma progresses. With the progression of glaucoma, functional deterioration and further vision loss is likely to follow. If the original dominant eye gets affected by glaucoma and suffers functional deterioration, the patient is likely to experience vision difficulty. It seems possible that patients with glaucoma may shift their dominant eye to the eye with less glaucomatous damage. In association with the hypothesis, Pan et al. [22] suggested that dominant eye has shifted just based on visual acuity in relatively short-term period.
In our previous paper [19], it has shown that the ocular dominance was associated with functional asymmetry between eyes with glaucoma. The neural basis of ocular dominance has been studied and there is no one mechanism that controls ocular dominance development. However, it is known from many studies that the fellow eye of occluded eye develops ocular dominance column and occluded eye experiences GABA-medicated synaptic depression [23-25]. These studies suggest that visual input may have an effect on ocular dominance plasticity. Recently, Ip et al. [7] reported the GABA inhibition in the human visual cortex relates to eye dominance. Considering that the apoptosis of retinal ganglion cell in glaucoma results from the retrograde degeneration of retinal ganglion cell, there is possibility that retrograde suppression may occur originating from ocular dominance column corresponding to nondominant eyes. To address this, further prospective studies regarding the effect of glaucomatous damage and its progression on ocular dominance are necessary.
Another noteworthy results are the characteristics in the central sector. Our results showed that there were marginal differences of functional and structural parameters between dominant and nondominant eyes in early-stage glaucoma. However, the central VF as well as average GCIPLT showed significant changes between dominant and nondominant eyes. Ganglion cells extend from the inner retina and then to lateral geniculate nucleus which is located in the midbrain. These are one of the most inner layers that act as the end of the neurons of retina. Ganglion cells are densely located in the central retina and relatively less dense in the periphery of retina. Moreover, cones are mostly one to one connected to ganglion cells, in other words they have low convergence, in the fovea of macula in order to provide high-resolution images [26]. In this regard, the central VF corresponding to macula seem to be advantageous for assessing the effect of ocular dominance. Therefore, central region may show more significant values relative to other regions in terms of ocular dominance.
There are several limitations to be acknowledged. First, in this study, only one eye dominance test was done: “the hole-in-a-card” test. Although the test was repeated three times, other methods to determine eye dominance and cross-validating could add more accuracy in determining patient’s ocular dominance. Moreover, the patient’s left or right handedness was not asked in the beginning. Relationship between ocular dominance and hand dexterity could have resulted in some other valuable information. Lastly, this study is a cross-sectional study. Thus, due to the study’s temporal limitation, there are restrictions in the interpretation of identifying associations. In the future, longitudinal study on the subjects may reveal more relationship.
In conclusion, the distribution of ocular dominance was different according to the stages of glaucoma. Eyes with less glaucomatous damage and right eye significantly determined the ocular dominance. Functional and structural intereye differences between dominant versus nondominant eyes were apparent in moderate to advanced glaucoma, whereas the differences were only marginal in early-stage glaucoma. Our results suggest the potential existence of reciprocal interactions of glaucoma and ocular dominance.

 PDF Links
 PubReader
 ePub Link
 Full text via DOI
 Full text via PMC
 Download Citation
 Print
Print


