


Idiopathic epiretinal membrane (iERM) is one of the most common retinal diseases in older adults, characterized by proliferation of fibrocellular tissues over the internal limiting membrane [1-3]. Traction forces caused on the retinal surface by the epiretinal membrane (ERM) results in the loss of foveal depression, disturbance of the inner and outer layers of the retina as well as retinal vessel movements [4-6]. These anatomic changes may cause decreased vision, metamorphopsia, and aniseikonia [1,4,5].
According to previous studies, the integrity of the ellipsoid zone is a prognostic factor in the visual acuity of patients with iERM [7]. The inner-retinal irregularity index has been suggested as a prognostic factor for iERM [8], but it could be difficult to measure in low-resolution optical coherence tomography (OCT) images, including time-domain OCT demanding a multi-step process in obtaining its value [8]. Thus, it might be complicated and time-consuming to use intuitively in real-world clinics.
Alternatively, anatomical recovery is the most intuitive hallmark of success in ERM surgery. However, despite successful ERM removal not all eyes regain foveal depression. Few studies exist on the recovery of foveal depression and surgical functional outcome. Mathews et al. [2] reported that in many of the patients (83%) loss of foveal depression persists after surgery. Twenty-seven out of 43 eyes did not recover foveal contour after surgery in a study done by Lim et al. [9]. Controversies exist in whether such foveal morphology has an impact on functional improvement. Some observed a faster visual acuity improvement in the anatomic recovery group, while others claim that an absence of foveal depression does not necessarily mean compromised visual acuity [2,9].
With the recent advancement of OCT angiography (OCTA), a noninvasive imaging technique that allows acquisition of high-resolution depth-resolved images of the retinal vascular layers [10], further investigation beyond the anatomic change is available. Studies on retinal diseases are being conducted based on the parameters of OCTA, which can clearly describe the complexities of the vessels at the edge of the foveal avascular zone (FAZ) [11]. In cases of patients with ERM, FAZ should be analyzed carefully, as ERM may disrupt the layered structure of the retina and distort FAZ owing to the architectural changes in the perifoveal capillary network [11]. Although there have been studies analyzing OCTA features after iERM surgery, few have studied OCTA features between different anatomic recovery groups (restoration vs. no restoration) to the best of our knowledge. Therefore, in this study we investigated the relationship between ophthalmic parameters—including OCT and OCTA findings—and anatomic recovery in eyes that had undergone vitrectomy for idiopathic ERM removal.
Materials and Methods
Subjects
We reviewed the medical records of patients who underwent pars planar vitrectomy (PPV) for removal of ERM between January 2019 and December 2019 at the Veterans Health Service Medical Center. The inclusion criteria were patients who had unilateral iERM above stage 2 according to the Govetto et al. [12]’s classification, which is defined by an absence of the foveal pit and disorganization of the retinal layers in the stages beyond. Patients with at least 6 months’ follow-up, preoperative and postoperative OCTA images obtained with sufficiently high quality for analysis were included. Those with recurrent ERM, diabetic retinopathy, retinal vessel occlusion, age-related macular degeneration, retinal break, or a history of vitrectomy surgery in the study eye, or any retina-associated pathology in the unaffected contralateral eye were excluded.
Surgery was performed by a single experienced vitreoretinal specialist. All patients underwent 25 G PPV, ERM removal, and internal limiting membrane peeling assisted with triamcinolone staining (40 mg/mL) (Constellation; Alcon Laboratories, Fort Worth, TX, USA). Phacoemulsification and posterior chamber lens implantation were performed during surgery in patients with phakic eyes.
Baseline data—age, gender, diabetes, hypertension, lens status, duration of ERM, best-corrected visual acuity (BCVA; logarithm of the minimum angle of resolution)—were obtained. Duration of ERM was calculated as the time between the initial day of diagnosis at our clinic (if medical record did not indicate otherwise) to the day of surgery. This study adhered to the tenets of the Declaration of Helsinki and was approved by the institutional review board of the Veterans Health Service Medical Center (No. 2019-02-005) in South Korea. Written informed consent was waived due to the retrospective nature of this study.
OCT and OCTA analysis
We used the swept-source OCT and OCTA system (DRI OCT Triton; Topcon, Tokyo, Japan) for the preoperative and postoperative examinations. OCT and OCTA images of both eyes were acquired at 3 and 0 months presurgery and 1, 3, 6, and 12 months postsurgery. Images taken 3 months before surgery were included in the analysis to weigh the effects of progression of retinal wrinkling causing potential OCTA segmentation errors.
OCT images were obtained as a three-dimensional macular (7 × 7 mm) scan, scan size 512 × 256 mm. For CFT, the distance between the inner limiting membrane and the inner surface of the retinal pigment epithelium on the central fovea was manually measured on the horizontal cross-sectional image, using the built-in scale of the OCT software. In addition, ellipsoid zone (EZ) disruption and inner-retinal irregularity index [8] were examined on OCT as prognostic factors. EZ was considered as a disruption if there was a discontinuity in the horizontal and vertical foveal B-scan. The inner-retinal irregularity index is defined as the length of the inferior border of the inner plexiform layer divided by the length of the retinal pigment epithelium. It was measured using a “freehand line” tool in the Image J software (National Institutes of Health, Bethesda, MD, USA) within a 3,000 μm Early Treatment Diabetic Retinopathy Study inner circle. To reduce error, the average inner-retinal irregularity index of three measurements was taken. In the OCTA volume scans of a central 6 × 6 mm area, initial retinal vasculature en-face image of superficial capillary layer was obtained via automated layer segmentation. All automated segmentations were re-evaluated for any layer segmentation errors and adjusted manually if present. The superficial capillary network was determined to be between 3 μm below the internal limiting membrane and to 15 μm below the inner plexiform layer. The FAZ area was defined as the central capillary-free area and measured using a “freehand selection” tool in Image J software (National Institutes of Health). The FAZ area in the superficial capillary layer and central foveal thickness (CFT) were independently measured by two individuals (BJB and YJC). The repeatability of the measurements between the two examiners was good for both the superficial capillary layer FAZ area (intraclass correlation coefficient = 0.95) and CFT (intraclass correlation coefficient = 0.99).
Defining foveal pit restoration
To assess the effect of the foveal pit contour on ophthalmic parameters, subjects were divided into two groups (the foveal pit contour “restoration [R]” and “no restoration [NR]” groups) according to postsurgical foveal pit changes. Foveal pit contour recovery was defined as reappearance of a depression of the fovea relative to the surrounding macula with the pit reaching the inner nuclear layer level. If the foveal pit recovered at any point after the operation, it was considered a recovery. The contour on OCT was independently evaluated by two individuals (BJB and YJC) and a third evaluator (NKR) adjudged when there was a discrepancy between two observers.
Statistical analysis
The Wilcoxon signed-rank test and paired t-test were used to compare the preoperative characteristics between the operative and contralateral fellow eyes. Two-sample t-tests and Mann-Whitney U-tests were used to compare the baseline characteristics, including BCVA, FAZ, CFT, EZ disruption, and inner-retinal irregularity index between foveal pit R and NR group. Changes in BCVA, FAZ, and CFT over time were analyzed using a repeated measures analysis of variance. Multiple linear regression analysis was performed with preoperative parameters to determine the factors associated with the postoperative FAZ area, CFT, and BCVA. All statistical analysis was performed using IBM SPSS ver. 21.0 (IBM Corp., Armonk, NY, USA). For all tests, a p-value of <0.05 was used to reject the null hypothesis.
Results
Of the 149 patients who underwent vitrectomy for iERM removal, 48 patients were excluded due to previously diagnosed retinal diseases either in the surgical or contralateral eye, and the other 58 patients were excluded because of a poor OCT/OCTA quality or an insufficient follow-up period. As a result, 43 patients with iERM were enrolled. Table 1 shows the baseline characteristics and comparison between the operative and contralateral eyes. The mean age of the patients were 75.07 ± 4.80 years. The mean period of ERM duration was 344.05 ± 238.72 days. The mean BCVA was worse in the iERM eyes (0.38 ± 0.31) than in the contralateral eyes (0.16 ± 0.14, p < 0.001). The mean preoperative FAZ area was smaller (0.10 ± 0.05 vs. 0.32 ± 0.07 mm2, p < 0.001) and mean preoperative CFT thicker (445.88 ± 49.94 vs. 220.81 ± 50.93 μm, p < 0.001) in the eyes with iERM than that in the contralateral unaffected eyes.
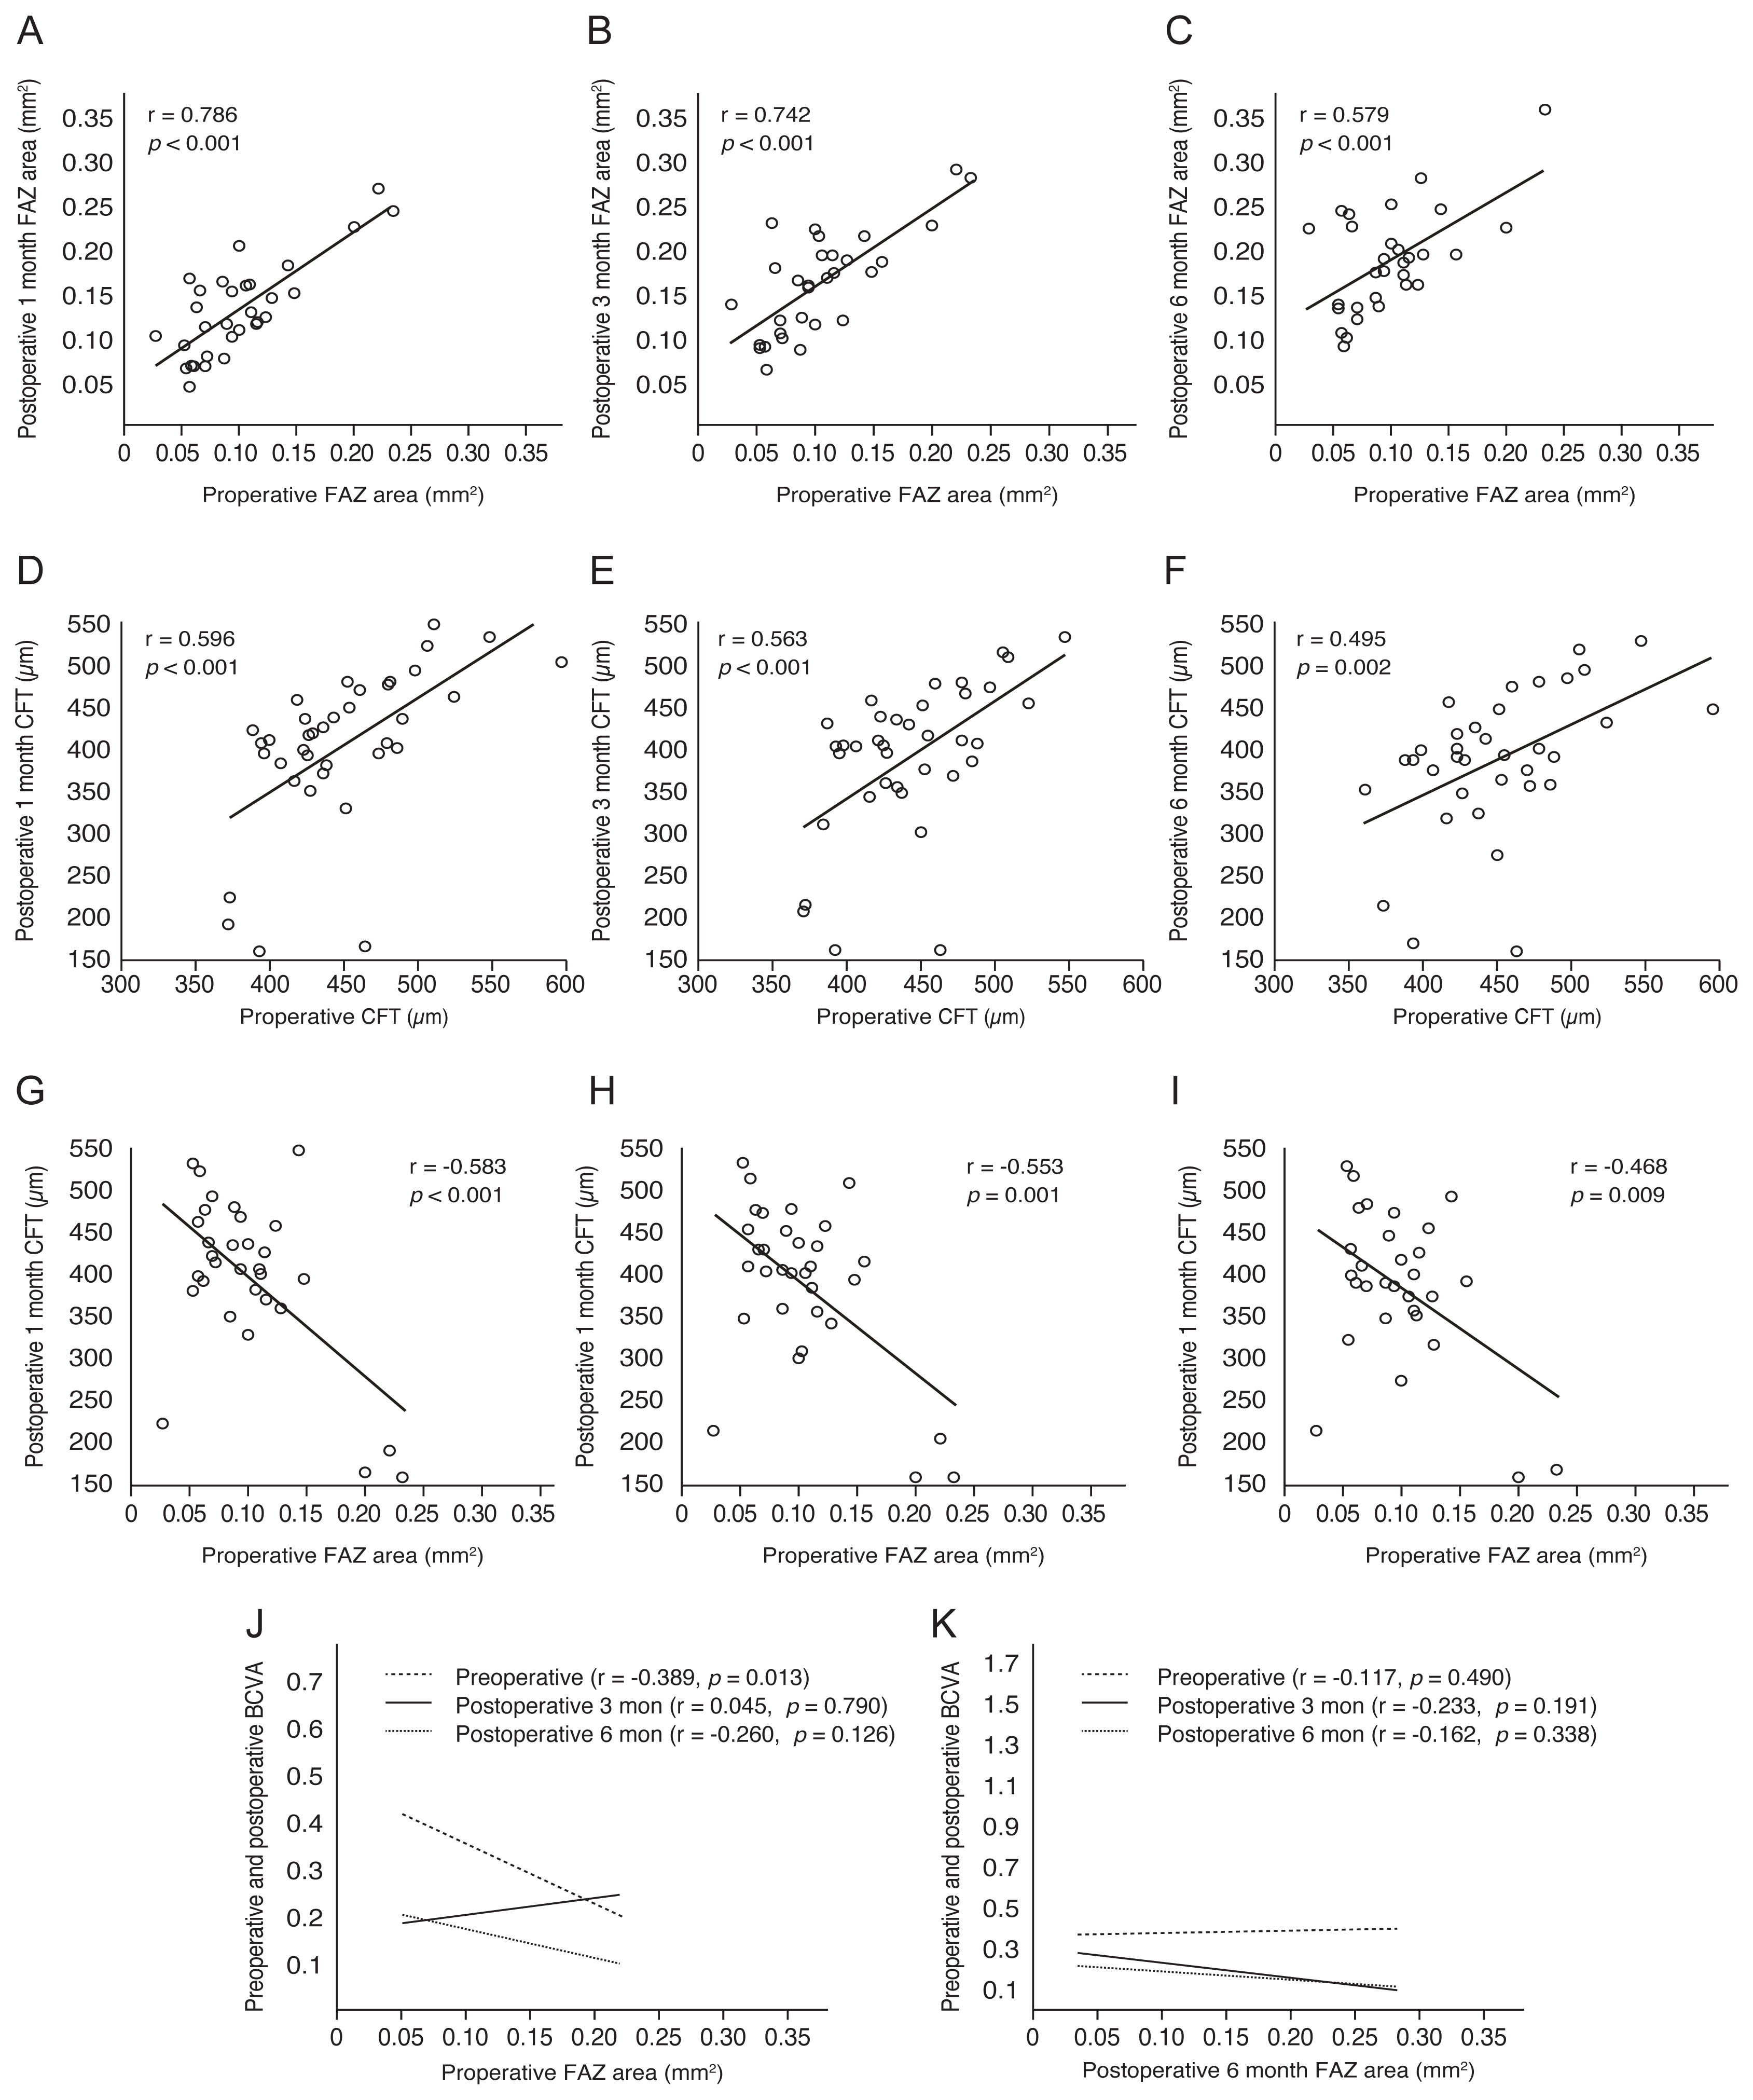
During the preoperative 3 months period, BCVA and FAZ slightly decreased and CFT increased in eyes with iERM (Supplementary Table 1). However, after surgery, BCVA (preoperative 0.38 ± 0.31 to postoperative 0.12 ± 0.10), FAZ (0.10 ± 0.05 to 0.19 ± 0.05 mm2) and CFT (445.88 ± 49.94 to 369.73 ± 71.25 μm) showed statistically significant improvements over time (p = 0.002, p < 0.001, p < 0.001, respectively) (Supplementary Table 1). Pearson correlation analysis was performed to detect any association between preoperative and postoperative FAZ and CFT at 1, 3, and 6 months (Fig. 1). Preoperative and postoperative FAZ areas (Fig. 1A-1C) and CFT (Fig. 1D-1F) had a positive association (p < 0.05). Preoperative FAZ was negatively correlated with postoperative CFT (Fig. 1G-1I). The degree of correlation shown as correlation coefficient on the plot decreases as time progresses after surgery. Additionally, the association between the FAZ and the BCVA was statistically significant only in the preoperative FAZ area and preoperative BCVA (all p = 0.013) (Fig. 1J, 1K).
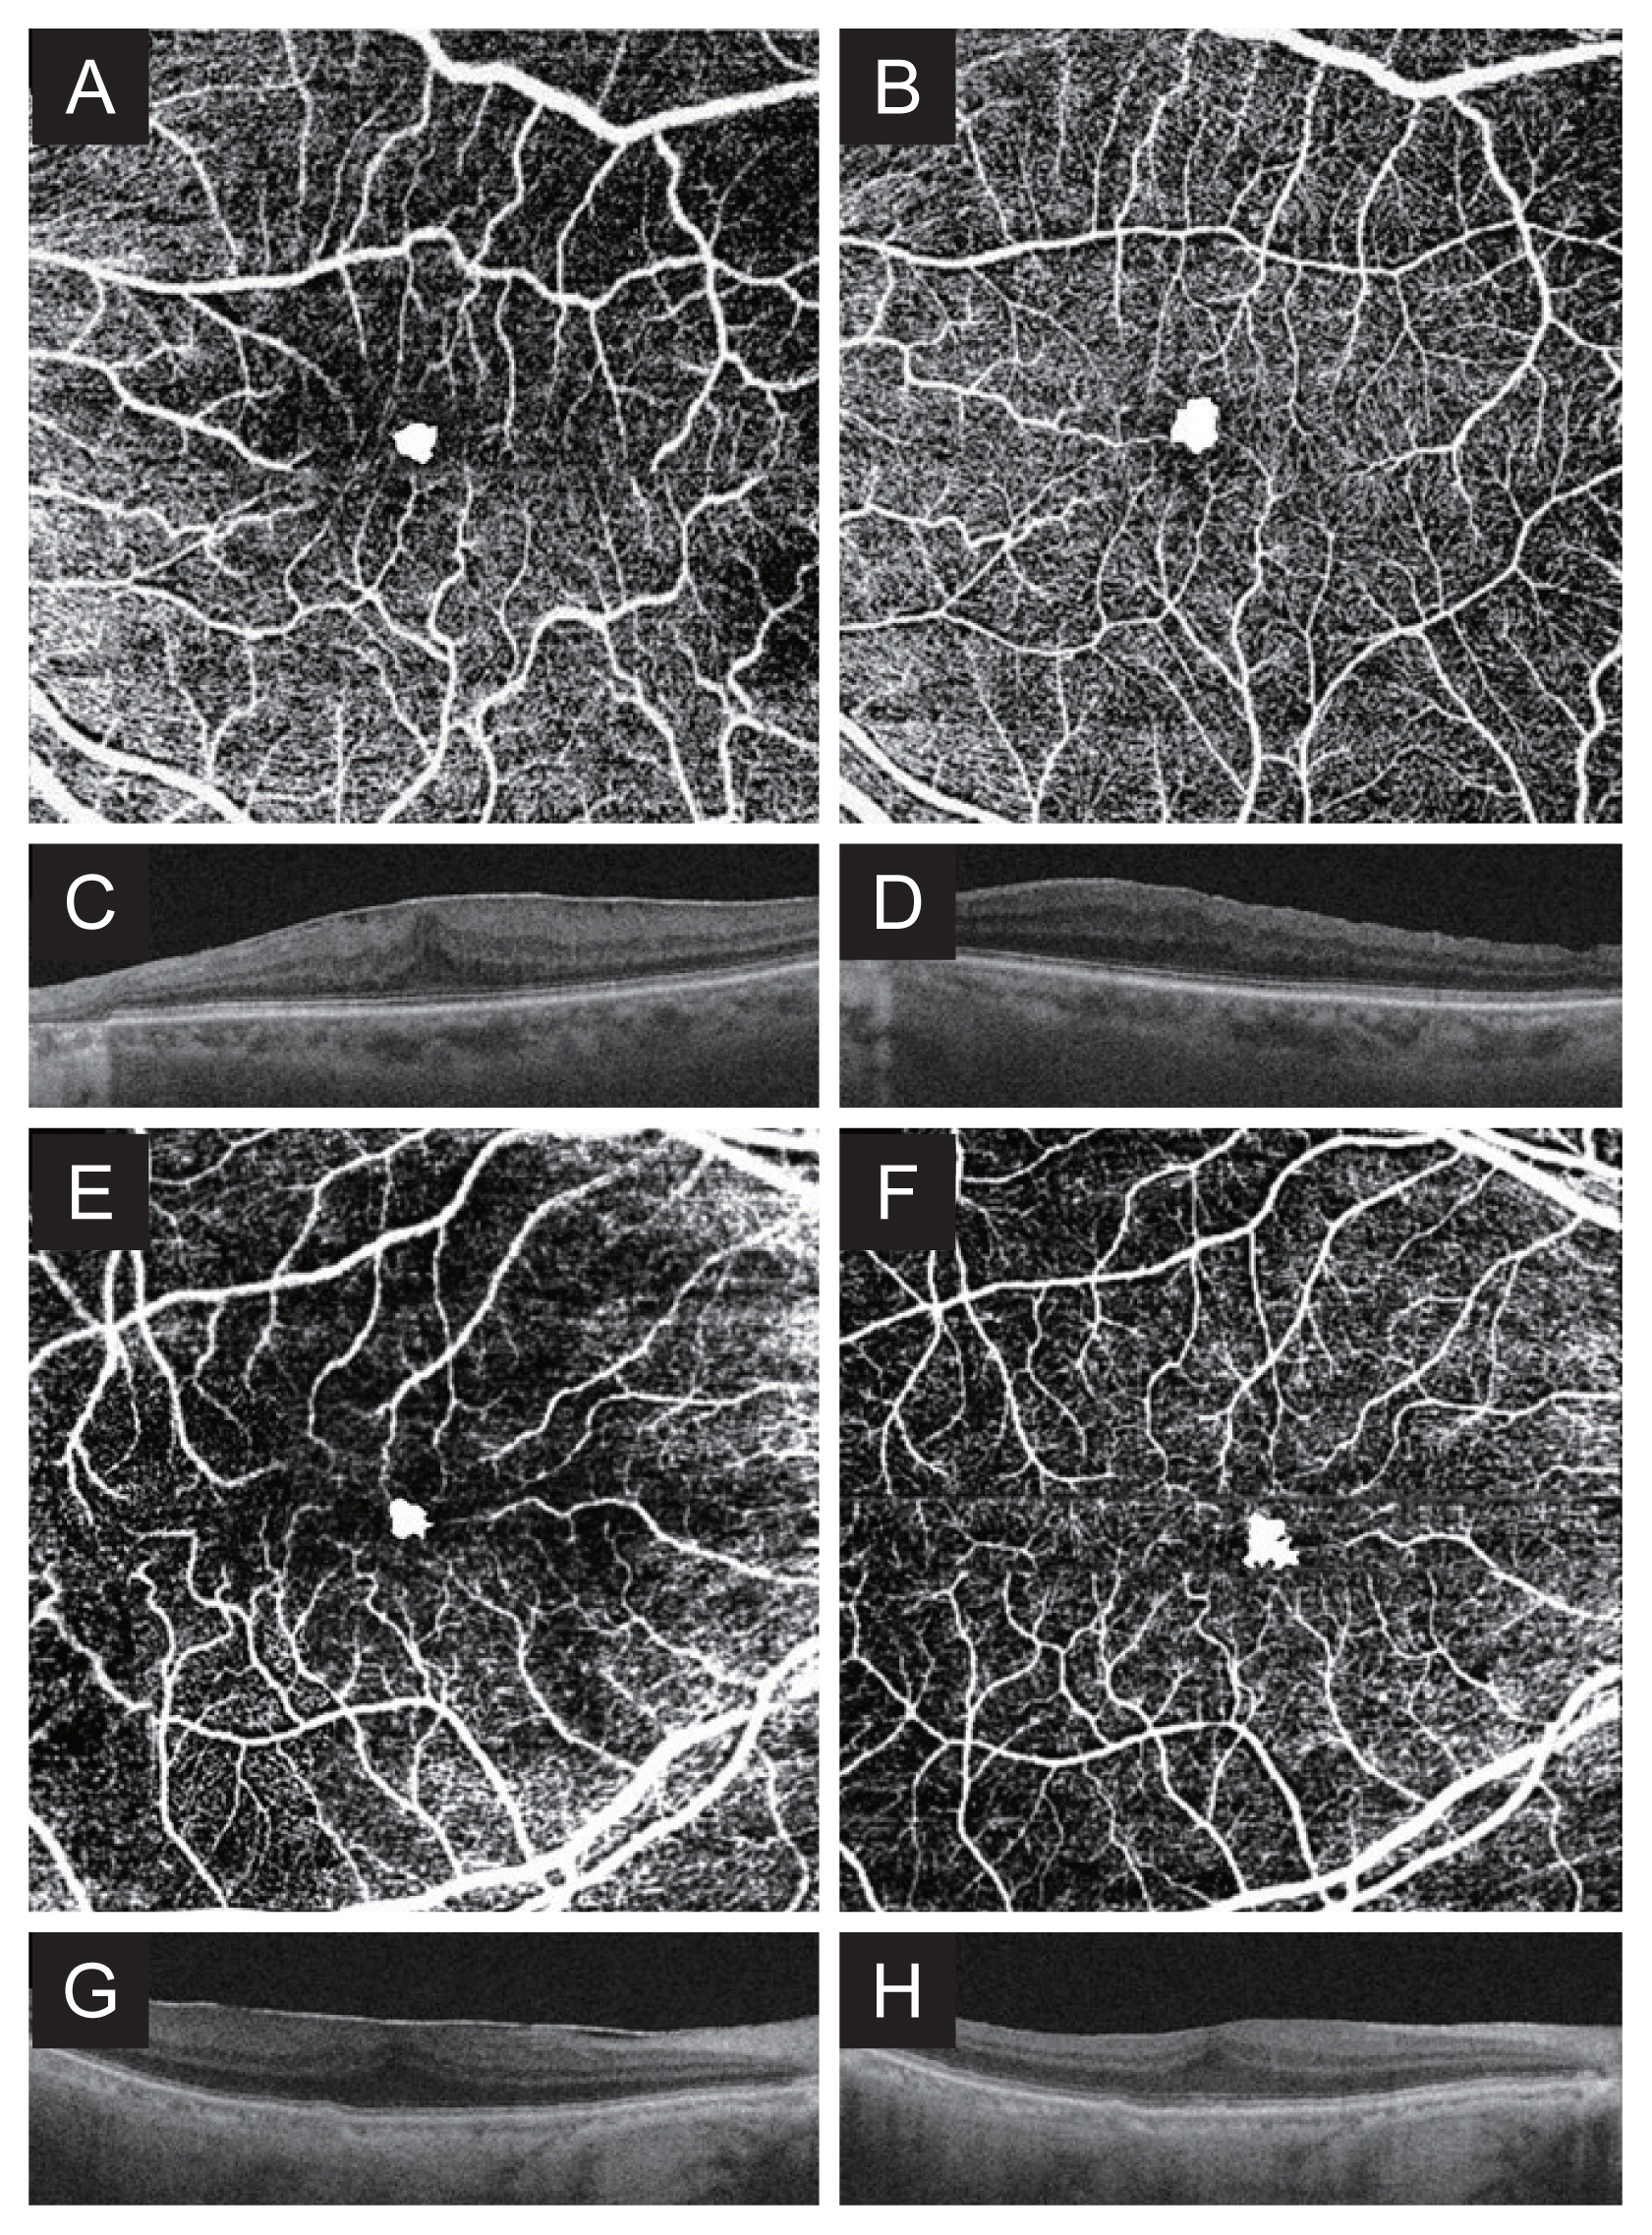
According to postsurgical foveal pit changes, subjects were divided into two groups (the foveal pit contour R and NR groups) (Fig. 2A-2H, 3A-3H). Among the 43 patients, 31 showed foveal pit restoration and 12 remained as no restoration (Table 2). In addition, 31 patients in the foveal pit restoration group were analyzed separately according to the time of restoration. Based on the time of initial recovery, 23 patients recovered 1 month after surgery. There were three, four, and one patients who first recovered at 3, 6, and 12 months after surgery, respectively. When comparing the ophthalmic parameters, including BCVA and FAZ areas, between the early foveal pit restoration group (within 1 month of surgery) and the late restoration group (at least 1 month after surgery) no statistically significant difference existed between the two groups (data not shown).
Baseline characteristics, such as age, diabetes, and hypertension, exhibited no significant differences in the foveal pit R and NR groups. Preoperative BCVA, FAZ area, contralateral FAZ area, contralateral CFT, preoperative EZ disruption, and inner-retinal irregularity index also had no significant difference. However, the mean preoperative CFT was thinner in the R group (429.55 ± 34.78 μm) than the NR group (485.33 ± 59.92 μm, p = 0.003). Duration of ERM was longer in the R group than the NR group (373.26 ± 243.79 vs. 268.58 ± 216.49 days, respectively; p = 0.034) with marginal significance.
Longitudinal changes of BCVA, FAZ, and CFT after ERM surgery up to 1 year were compared between the R and the NR groups (Table 3). The BCVA significantly improved in both R and NR group over time (p = 0.003, p = 0.014, respectively) (Table 3). No difference in the degree of improvement in BCVA existed between the two groups (p = 0.619) (Table 3). The mean BCVA was better in the R group at 1 month and 6 months postoperatively (p = 0.004 and p = 0.02, respectively) (Table 3). However, BCVA recovered to 0.12 ± 0.11 in the R group and 0.12 ± 0.07 in the NR group, showing no statistical difference at 12 months. The FAZ area also significantly increased over time in both R and NR group (p < 0.001 and p < 0.001, respectively). There was no difference in the increment of FAZ area between the two groups (p = 0.139) (Table 3). Differences in the FAZ area was significant between the two groups up to 6 months postoperatively (p = 0.019), however insignificant at 12 months (p = 0.158) (Table 3). The CFT was thinner in the R group at every point compared to the NR group (all p < 0.05) (Table 3). The R group showed statistically significant improvement in CFT over time (p = 0.002) (Table 3). The CFT also continuously decreased in the NR group—from preoperative 485.33 ± 59.92 μm to 416.71 ± 43.05 μm at 12 months—with marginal significance (p = 0.053) (Table 3). However, the decrement of CFT between the two groups was not statistically different (p = 0.378) (Table 3).
In addition, preoperative EZ disruption was significantly associated with worse BCVA at 1, 3, 6, and 12 months postoperatively (p = 0.023, p = 0.03, p = 0.001, and p = 0.019, respectively). Postoperative EZ disruption was also significantly correlated with worse BCVA at 1, 3, and 6 months postoperatively (p = 0.019, p = 0.025, and p = 0.011, respectively), whereas preoperative and postoperative EZ disruptions were not correlated with foveal pit restoration (p = 0.41 and p = 0.367, respectively). Alternatively, 6 months postoperative inner-retinal irregularity index was significantly associated with foveal pit restoration (R group, 1.030 ± 0.008 vs. NR group, 1.040 ± 0.010; p = 0.001). Furthermore, BCVA was significantly better in the R group than the NR group (R group, 0.14 ± 0.14 vs. NR group, 0.25 ± 0.17; p = 0.02). However, preoperative inner-retinal irregularity index was not correlated with foveal pit restoration (R group, 1.139 ± 0.19 vs. NR group, 1.165 ± 0.029; p = 0.243). Likewise, postoperative 12 months inner-retinal irregularity index was not correlated with foveal pit restoration (R group, 1.017 ± 0.006 vs. NR group, 1.017 ± 0.019; p = 0.618). Its BCVA was not associated with foveal pit restoration (R group, 0.12 ± 0.11 vs. NR group, 0.12 ± 0.07; p = 0.576). Preoperative inner-retinal irregularity index was not correlated with postoperative BCVA (all p > 0.05).
Discussion
This study investigated the relationship between ophthalmic parameters—such as BCVA, CFT, FAZ area, EZ disruption, and inner-retinal irregularity index—and anatomic recovery in eyes that had undergone vitrectomy for idiopathic ERM removal. The primary objective was to evaluate whether postsurgical foveal pit changes had any predictive or prognostic factors.
Removal of epiretinal membrane significantly decreases the CFT and increases the superficial FAZ area. The expansion of FAZ was significant after surgery, however remained smaller than the contralateral unaffected eye. It may be possible that before ERM surgery, strong centripetal contractions act on the FAZ, and after ERM removal, centrifugal expansion occurs. In addition, the preoperative FAZ area was significantly correlated with the postoperative FAZ area. These results are consistent with previous reports [13-15].
In normal eyes, a lower CFT is associated with a larger FAZ area [13,16]. However, in this study, preoperative CFT and FAZ areas were not correlated (p > 0.05, data not shown), while the postoperative CFT and FAZ areas were significantly associated by Pearson correlation analysis at any point. This is probably because, before ERM surgery, the strong afferent contraction of the ERM and anteroposterior traction by the vitreous act on the FAZ, disrupting the normal FAZ morphology. The preoperative FAZ area showed negative correlation with postoperative CFT at 1, 3, and 6 months (all p < 0.05). Yoon et. al. [14] also reported this negative correlation between superficial FAZ area and CFT.
This study verified that the preoperative FAZ area was negatively correlated with preoperative BCVA (all p = 0.013). A smaller FAZ may have more severe ERM contraction and foveal retinal structure abnormalities than a larger FAZ [17]. Therefore, preoperative BCVA could be worse in ERM with a smaller preoperative FAZ area. This result is consistent with the findings of Yoshida et al. [18].
Preoperative and postoperative EZ disruption were significantly correlated with worse BCVA after surgery, which is consistent with the previous reports [7,8]. Moreover, the inner-retinal irregularity index was significantly lower in the R group than the NR group 6 months after surgery, and its BCVA was significantly better in the R group than the NR group. However, there was no significant difference in the inner-retinal irregularity index or BCVA between the two groups 12 months after surgery. The conflicting results between the two time points could be explained as follows: the inner nuclear layer, which plays an important role in the visual prognosis of the ERM [8], can be restored by removing the tangential traction after ERM surgery. Meanwhile, there might be a difference in the recovery velocity of the inner nuclear layer between the R and NR groups, which possibly affected the visual acuity at 6 months postoperatively. Subsequently, with a gradual decrease in the velocity effect, there was no difference in the visual acuity between the two groups at 12 months postoperatively.
Few studies exist which analyze the effect of the postsurgical foveal pit restoration in eyes with iERM. In our study, the BCVA was significantly better in the R group than in the NR group 1 month postoperatively (p = 0.004); however, after 12 months, the BCVA in both groups improved compared to the preoperative BCVA without a significant difference (p = 0.576). This means that even if the foveal pit contour does not recover, long-term visual acuity improvement can be achieved, which supports the finding of a previous study that the absence of postoperative foveal depression does not imply failure to improve the BCVA [2]. Additionally, majority of the R group recovered within one month of surgery (23 out of 31). We also found that this early foveal pit restoration group within 1 month of surgery did not exert any benefit in visual acuity improvement than the late restoration group. According to a previous study by Lim et al. [9], unlike our study, the degree of BCVA improvement was greater in patients who showed rapid foveal pit recovery within 1 month after surgery than in patients who did not show foveal pit recovery after surgery. However, although the recovery group showed faster BCVA improvement after surgery than the non-recovery group, there was no significant difference in the BCVA between the two groups 12 months postoperatively, as in our study.
No significant differences existed in the preoperative FAZ area in both R and NR group. However, after vitrectomy, FAZ area increased and differences between the two groups were evident at 3 and 6 months. Unlike continuous and immediate improvement of CFT, it is thought that superficial FAZ is more exposed to traction and mechanical stress caused by ERM, which delays its restoration after surgery [14]. Dubis et al. [19] reported that in normal eyes the degree of foveal depression may be positively correlated with the size of FAZ. We can speculate that since most of our restoration group recovered within 1 month the degree of foveal depression increased and the FAZ expanded in a delayed manner during the following months resulting in such significant difference up to 6 months. However, as FAZ genuinely enlarges after epiretinal membrane removal regardless of the state of foveal depression, the velocity effect wears off and the difference becomes insignificant at 12 months.
ERM tends to aggravate with time [1,9]. However, unlike our expectation, the duration of ERM does not seem to have an impact on anatomic restoration. When compared between the R and NR group, the duration of ERM was longer in the R group. Nonetheless, since duration of ERM could only be estimated with medical record based on the time of presentation of the patient to the clinic and not the generation of ERM itself, careful interpretation is required.
This study is unique in that we analyzed all features not only immediate to the operation day, but 3 months prior to the surgery. OCTA image quality tends to be inaccurate in patients with severe retinal degeneration due to ERM [6], and ERM may disrupt the retina’s layered structure; hence segmentation errors may exist in FAZ analysis [18]. According to Bontzos et al. [20], the iERM period is significantly related to segmentation errors in OCTA. As such, there may be increased measurement errors in the OCTA image immediate to surgery; therefore, in this study, to overcome the inherent limitation of OCTA analysis, OCTA images taken 3 months before surgery, expecting relatively little disruption of the retinal layer, were also analyzed. However, there were no significant differences between the two image measurements (p = 0.90). In other words, as long as manual adjustment is applied for segmentation errors, FAZ area may be reliable without significant discrepancy at any point before surgery.
Although studies exist which evaluates the OCTA features after vitrectomy in iERM, this study is the first, within our knowledge, to investigate OCTA features between different anatomic recovery groups (R vs. NR). However, the retrospective nature and small sample size remain as a limitation of this study. Future studies with larger sample size, and longer follow-up period may be beneficial.
In conclusion, the removal of epiretinal membrane in PPV significantly decreases the CFT and expands the superficial FAZ and improves BCVA. Foveal pit restoration improves BCVA, CFT and FAZ area possibly at a faster rate in the early months but the change becomes insignificant at 12 months and long-term improvement could be achieved regardless of the status of foveal pit restoration.

 PDF Links
 PubReader
 ePub Link
 Full text via DOI
 Download Citation
 Supplement
 Print
Print


