

In developed countries, neovascular age-related macular degeneration (NV-AMD) is a major cause of acquired blindness in elderly patients. NV-AMD is characterized by abnormal choroidal neovascularization (CNV); it causes hemorrhage and exudation, leading to subfoveal scarring and photoreceptor cell damage. Several treatments for resolving the exudative change have been reported, including anti-vascular endothelial growth factor (VEGF) therapy [1,2,3] and photodynamic therapy [4,5,6]. Anti-VEGF therapy has become a first-line treatment of choice for NV-AMD because not only is the initial visual outcome improved, but this improvement can also be maintained via periodic intravitreal injections.
In the diagnosis and monitoring of NV-AMD, spectral domain optical coherence tomography (SD-OCT) with a resolution of 5 µm has allowed layer-by-layer assessment of intraretinal microstructures, including the photoreceptor inner and outer segment junction (IS/OS) and the external limiting membrane (ELM). In some studies, the IS/OS line on the SD-OCT images was reportedly a good indicator for predicting visual acuity (VA) in NV-AMD patients treated with photodynamic therapy [7] or anti-VEGF [8]. ELM status is another useful SD-OCT parameter during the evaluation of retinal morphology and function in patients with NV-AMD [9]. However, these previous studies evaluated post-treatment VA according to changes in only one or two SD-OCT parameters.
SD-OCT provides various information in addition to that relating to the IS/OS and ELM. Therefore, we investigated all accessible SD-OCT parameters of NV-AMD patients quantitatively, both before and after anti-VEGF treatment, and evaluated the changes in these parameters in conjunction with the changes in VA after anti-VEGF treatment. Using these results, we aimed to identify any SD-OCT parameters that could predict VA improvement after anti-VEGF treatment in NV-AMD patients.
Materials and Methods
The medical records of patients with treatment-naïve NV-AMD who visited the Nune Eye Hospital and underwent three or more consecutive intravitreal ranibizumab (Lucentis; Genetech, South San Francisco, CA, USA) injections from March 2009 to May 2011 were reviewed retrospectively. The study was approved by our Institutional Review Board. Sixty-two eyes of 59 patients were studied. All participants underwent best-corrected VA, intraocular pressure assessment, fundus photography, fluorescein angiography, and indocyanine green angiography. VA was measured with an ETDRS (Early Treatment Diabetic Retinopathy Study) chart and converted to a logarithm of the minimal angle of resolution (logMAR) units for statistical analysis.
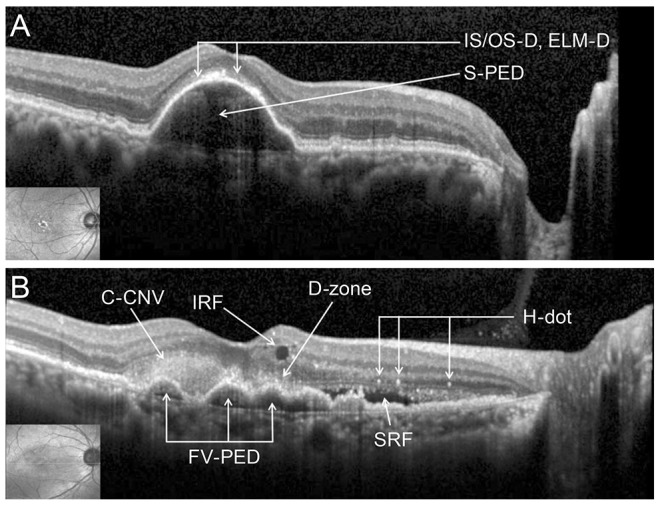
A SD-OCT (Heidelberg Engineering, Dossenheim, Germany) examination was performed at the initial visit and again each month throughout treatment with three consecutive monthly ranibizumab intravitreal injections. Horizontal scans of the macula were recorded for each eye. The eye tracking system of the SD-OCT guaranteed the same position of the scans before and after treatment. The foveal center was manually defined during the examination. The SD-OCT findings that we analyzed were the serous pigment epithelium detachment (S-PED), fibrovascular pigment epithelium detachment (FV-PED), classic choroidal neovascularization (C-CNV), subretinal fluid (SRF), intraretinal fluid (IRF), dense zone of the outer retina (D-zone), hyper-reflective dots (H-dots), disruption of the IS/OS (IS/OS-D), disruption of the ELM (ELM-D), the length of the intact IS/OS line (IS/OS length), the length of the intact ELM (ELM length), and the mean central foveal thickness (CFT) (Fig. 1). All SD-OCT findings were measured within 1 mm from the fovea center to both sides (nasal and temporal) because the diameter of the physiologic fovea is 1.85 mm [9].
The IS/OS length and ELM length were measured manually using an SD-OCT caliper tool (Fig. 2). IS/OS-D and ELM-D were defined as disruption to these lines of 50% or more. Mean CFT was measured by an automated program that is a component of the SD-OCT equipment, which calculates the average retinal thickness within the circle defined by a 500-µm radius from the foveal center.
Participants were divided into three groups according to the changes in VA from pre-treatment to post-treatment. Eyes in which the VA decreased were classified as the worsened group (group W), while eyes in which it remained unchanged were placed in the static group (group S). The improved group (group I) was made up of eyes in which VA increased.
Two blinded authors (DKL and YHK) obtained the SD-OCT measurements and categorized the participants into groups. When there were discrepancies in the judgments of parameters, the third author (OWK) made the final decision.
All statistical analyses were performed using the SPSS ver. 18.0 (SPSS Inc., Chicago, IL, USA). All values are reported as the mean ± standard deviation. The paired t-test was used for comparisons of the VA, CFT, IS/OS length, and ELM length before and after treatment. The correlations between parameters were quantified via Pearson's correlation analysis. The parameter values derived from the OCT images were compared using a chi-square test incorporating the three groups. Measurements from each group were compared using one-way analysis of variance. A p-value of < 0.05 was considered to be statistically significant.
Results
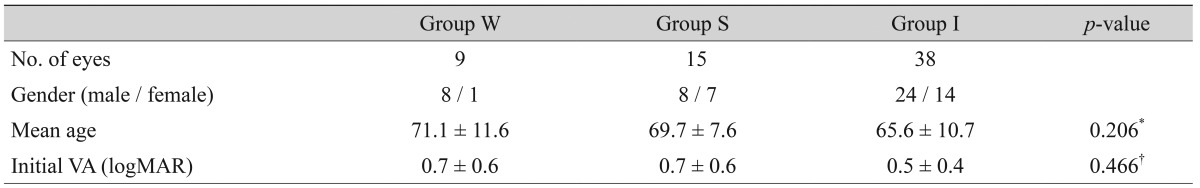
Sixty-two eyes of 59 patients with treatment-naïve NV-AMD were included in this study. The patient demographics are shown in Table 1. The mean age and initial VA did not have a statistically significant difference among the three groups. At the initial examination, all eyes exhibited distinguishing features of NV-AMD upon SD-OCT and marked exudative change. The exudative change of eyes in all groups was resolved after anti-VEGF treatment.
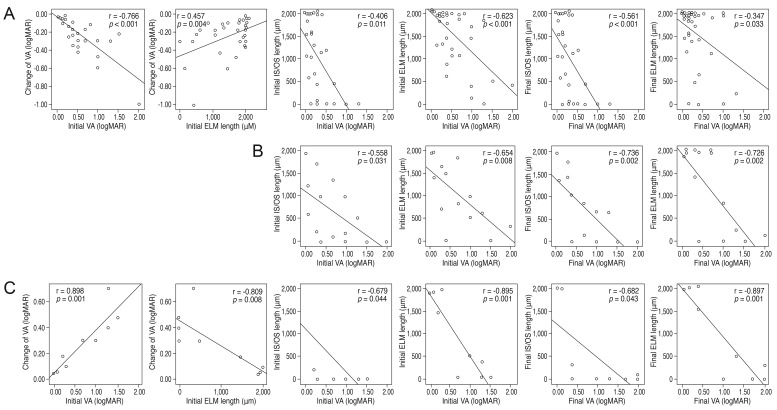
The correlation analysis results are shown in Fig. 3. Interestingly, in groups I and W, better initial VA and initial ELM lengths were associated with less change in VA after treatment. Therefore, a better initial VA did not assure a better visual outcome. The initial IS/OS length was not correlated with the change in VA after treatment in all groups. A better initial VA was associated with a longer initial IS/OS length and initial ELM length in all groups. The final VA was also significantly correlated with the final IS/OS and ELM length in all groups, in the same manner as the initial VA. These results are concordant with those of a previous study [10] and suggest that IS/OS length and ELM length correlate with visual function.
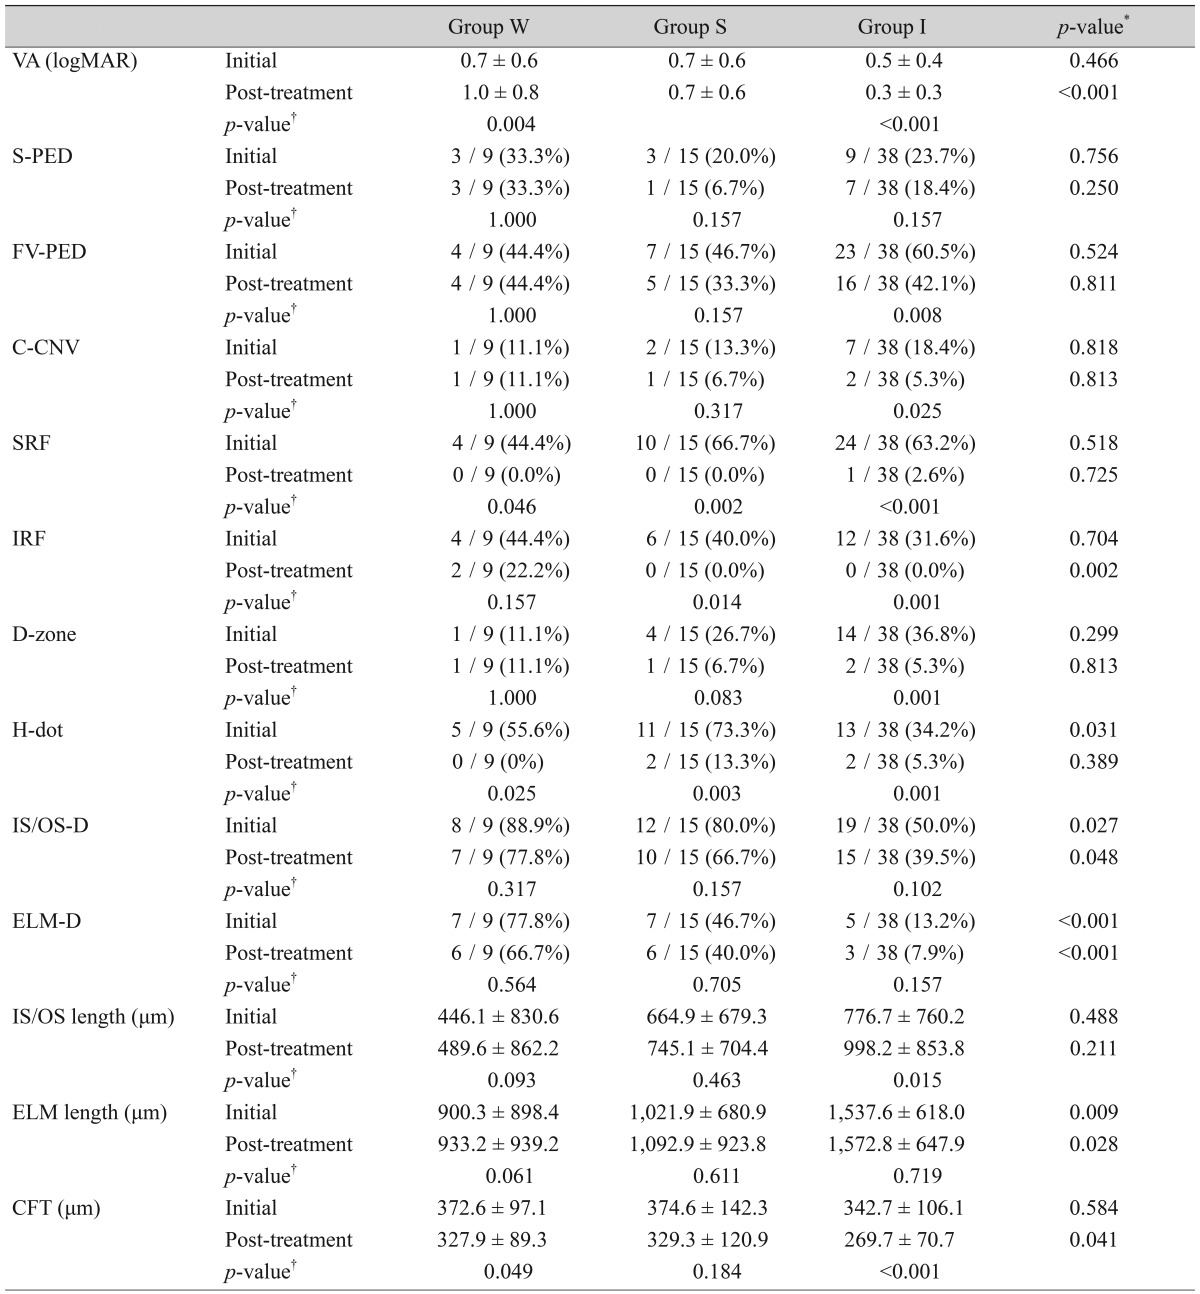
Table 2 shows the incidence of all SD-OCT determinations and measurements. The p-values in the columns are related to comparisons between initial and post-treatment SD-OCT findings, and those in the rows are related to comparisons between the three groups. Initial and post-treatment VA differed with statistical significance in groups W and I, and the post-treatment VA between the three groups was also different. FV-PED, C-CNV, D-zone, and IS/OS length were improved in group I only; however, initial and post-treatment values did not differ significantly between the three groups. SRF decreased in all groups after treatment, and IRF decreased in groups S and I; these parameters did not differ significantly between the three groups. Initial and post-treatment S-PED did not differ significantly between the three groups. All groups showed a significant difference for H-dot, but it did not differ significantly between the three groups. With regard to values obtained at the initial visit, only three parameters, IS/OS-D, ELM-D and ELM length, differed significantly between the three groups. These parameters also separated the three groups in conjunction with differences between the initial and post-treatment VA values, suggesting that they could be used to predict post-treatment visual outcomes. A lower incidence of IS/OS-D and ELM-D and a longer ELM length at the initial visit were associated with better visual outcomes at the final visit. CFT differed significantly between the three groups post-treatment but not at the initial visit.
Discussion
In this study, we investigated the incidences and measurements of all available SD-OCT parameters in conjunction with VA changes after anti-VEGF injection in age-related macular degeneration (AMD) patients, with the aim of identifying initial SD-OCT findings that might predict visual outcomes. Only three parameters, IS/OS-D, ELM-D and ELM length, differed significantly between the three groups at the initial visit and post-treatment. Lower incidences of IS/OS-D and ELM-D and longer ELM length were associated with better visual outcomes. This finding suggests that these parameters may be useful predictors of visual outcomes. We also compared the change in VA, not the final post-treatment VA, with the SD-OCT measurements; this change differed from that reported by previous studies [7,10]. We chose this method because the response to treatment is defined as the degree of VA change, not the final post-treatment VA. Interestingly, better initial VA and ELM length were associated with a lesser degree of change in VA after treatment in groups I and W. Thus, an initial higher VA and a longer ELM length did not guarantee significantly greater visual improvement. On the other hand, incidence rates between the three groups were slightly different. The incidence of the initial ELM-D differed significantly between the three groups, and better visual outcomes were associated with lower incidences of this finding. Although the ELM length itself is not informative with regard to predicting visual outcome, we suggest that the presence of ELM-D may be a strong predictor of visual outcome in AMD patients after anti-VEGF treatment.
The strong correlations between the initial VA and the initial IS/OS length and the ELM length were very similar to those reported in a previous study by Shin et al. [10]. That study compared the initial VA with the initial length of the disrupted IS/OS, and the final VA with the final length of the disrupted IS/OS length, and these results were strongly correlated. We additionally compared the initial VA with the initial ELM length, and the final VA with the final ELM length. These comparisons also exhibited consistent correlations in the three groups. The mean IS/OS lengths and ELM lengths were closely associated with visual function. However, they did not predict the visual outcome after anti-VEGF treatment in AMD patients.
Of all the parameters investigated, only IS/OS-D, ELM-D, and ELM length exhibited predictive potential. SRF and H-dots were highly responsive to treatment in all groups regardless of VA improvement. These parameters may be associated with a decrease in exudative change. The improvements of FV-PED and C-CNV observed in group I may have been a direct result of anti-VEGF treatment; however, the factors influencing differences in responsiveness for anti-VEGF remain unknown. With regard to the disruption of the outer segment of the fovea caused by longstanding exudative change, we suggest that anti-VEGF treatment may only improve the exudative change, not visual function. Further research is required to confirm whether or not this is the case. In a study by Oishi et al. [11], CFT was negatively correlated with VA in eyes with a foveal thickness >203 µm. In our study, however, the initial CFT was not correlated with the initial VA, and the final CFT was not correlated with final VA (data not shown). These observations are consistent with previous studies [7,12,13].
We divided the participants into three groups based on different criteria than were used in previous studies. Hayashi et al. [7] and Shin et al. [10] categorized their participants into groups based on IS/OS line status: complete, discontinuous or absent. Oishi et al. [11] used ELM status to classify participants into three groups: absent, discontinuous or complete. We divided our patients into three groups according to visual outcome (improved, static, or worsened) after anti-VEGF treatment, not SD-OCT findings, and investigated the associations between the SD-OCT findings and these visual outcomes. We suggest that this form of analysis may be more informative with regard to associations between SD-OCT findings and visual outcomes than those used by previous studies.
The present study had several limitations, including its retrospective nature and the relatively small sample size, particularly in group W. Polypoidal choroidal vasculopathy was not differentiated from typical neovascular AMD. Although the images were analyzed in a blinded manner, the classification of OCT images in the present study was based on personal judgment and manual measurement of the ELM and IS/OS length. The ELM and IS/OS length could not be measured in all cases due to exudation and hemorrhage of the choroidal neovascularization and disruption of the foveal area. For these reasons, we suggest categorization based on the integrity of the IS/OS line and the ELM line, rather than measuring their numeric lengths. We also divided the integrity of these lines into two categories according to their lengths. However, we could not determine the relationship between IS/OS or ELM integrity and visual function; only statistically non-significant trends were apparent with regard to visual outcome.
In conclusion, we suggest that IS/OS-D, ELM-D and ELM length may be good predictors of visual outcome after anti-VEGF treatment in NV-AMD patients. More specifically, the absence of IS/OS-D or ELM-D or a longer ELM length at the initial visit suggested that improved visual function was likely, although these parameters do not reflect visual function itself.

 PDF Links
 PubReader
 Full text via DOI
 Full text via PMC
 Download Citation
 Print
Print


