

Optic disc pallor is a hallmark of optic atrophy. Changes in optic disc pallor, as evaluated by ophthalmoscopy, coincide with retinal nerve fiber layer (RNFL) thinning and rearrangement of the remaining disc astrocytes into dense parallel layers across the optic nerve head [1,2,3]. Vascular dysregulation can also cause optic disc pallor [4]. Optical coherence tomography (OCT), which is objective, quantifiable and reproducible, is commonly used to measure RNFL loss, and OCT can be useful to quantify optic atrophy [5,6]. Optic disc pallor is an important feature of optic neuropathy although it is currently a subjective, comparative measure.
Several reports have objectively evaluated optic disc pallor using different techniques (e.g., scanning microdensitometry and fundus reflectometry) [7,8]. Unfortunately, these techniques require specialized equipment. We previously demonstrated quantitative optic disc pallor analysis using fundus photography and free image analysis software, ImageJ (US National Institutes of Health, Bethesda, MD, USA). These readily available tools were used to obtain highly reproducible, objective evaluations of optic disc color [9]. The purpose of the current study was to investigate whether optic disc pallor, objectively quantified by Image J software, is correlated with OCT-measured RNFL loss.
Materials and Methods
All subjects were enrolled at the Kim's eye hospital. Patients with traumatic optic neuropathy (TON), who had been followed for at least 6 months between August 2009 and August 2011, were enrolled. All patients had relative afferent pupillary defects in the affected eye. Exclusion criteria included previous use of a glaucoma medication, past history of optic neuropathy, previous intraocular surgery (e.g., cataract removal), and presence of a dysmorphic optic disc. The control group consisted of eyes that had no RNFL loss, as measured on OCT, normal visual fields, and best-corrected visual acuity ≥20 / 25. To determine the normal range (within the 95% confidence intervals) of optic disc brightness, optic disc color was measured and analyzed in healthy, age-matched controls. This research study was reviewed and approved by the institutional review board of Kim's Eye Hospital and all procedures conformed to the Declaration of Helsinki guidelines.
Optic disc brightness score evaluation using fundus photography
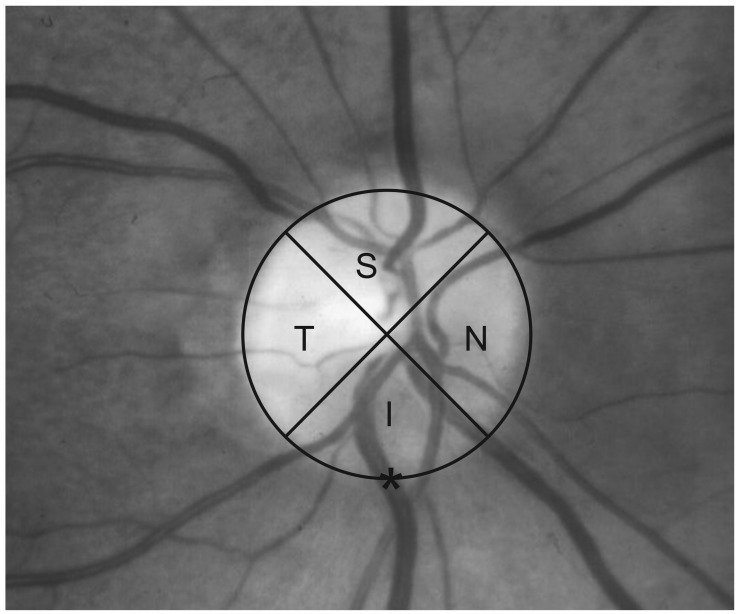
Optic disc photographs were taken by experienced photographers using a Kowa nonmyd7 fundus camera (Kowa, Tokyo, Japan) with a Nikon d70s digital camera (Nikon, Tokyo, Japan) attached. Optic disc images were captured using the Kowa program and image capture settings yielded JPEG image files with a medium resizing quality. The optic disc was divided into the same 4 quadrants (temporal, superior, nasal and inferior) as in the standard OCT RNFL quadrant map (Fig. 1).
Color optic disc images were converted to gray scale images and overall disc brightness was measured with the ImageJ software, which converts gray scale images to intensity per pixel to calculate brightness values. For color images, a gray scale histogram was calculated by converting each RGB image into a gray scale value using the following formula [5]: V = 0.299R + 0.587G + 0.114B (V = Y; R = red; G = green; B = blue).
To minimize the fundus photograph contrast bias, individual quadrant gray scale values were divided by the gray scale value for the largest retinal vein (Fig. 1) in that image.
Retinal nerve fiber layer thickness using optical coherence tomography
All patients were scanned with the Cirrus OCT (software ver. 5.0.1; Carl Zeiss Meditec, Dublin, CA, USA) using the fast RNFL thickness protocol with internal fixation. All OCT parameters, including overall and individual quadrant average RNFL thickness results, were based on the 6 × 6 mm cube captured in the Optic Disc Cube 200 × 200 scan. Only scans with a signal strength ≥6 were included in the analyses.
Optic disc brightness score and retinal nerve fiber layer thickness correlation
The correlation between optic disc brightness score and average OCT RNFL thickness in each quadrant was investigated. Average RNFL thickness was also compared to the total gray scale value of the optic disc, as captured on fundus photographs. Data were analyzed using SPSS ver. 15.0 (SPSS Inc., Chicago, IL, USA) and the Spearman correlation coefficient was calculated to evaluate the statistical significance of the correlation. Statistical significance was defined as a p-value <0.05.
Results
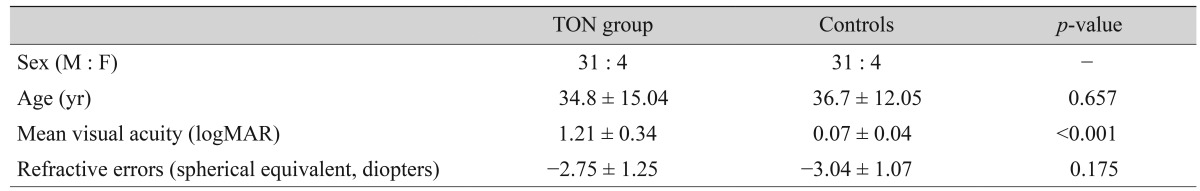
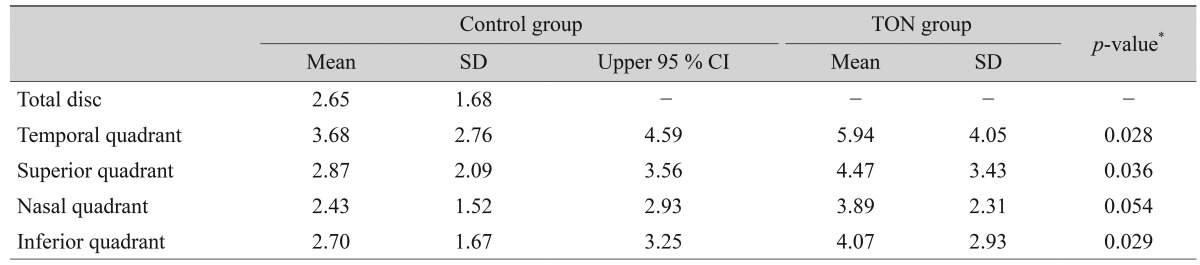
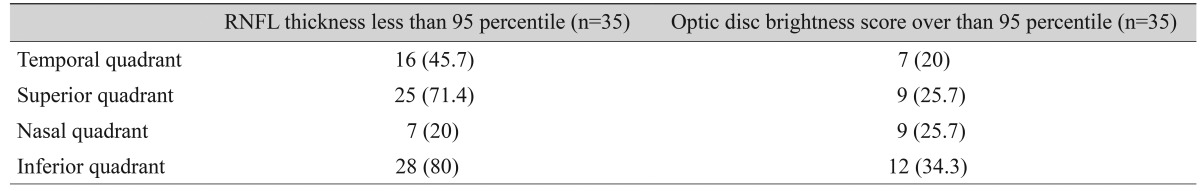
A total of 35 patients (31 male, 4 female) were enrolled in the study. The mean participant age was 34.8 ± 15.0 years (range, 5 to 63 years) (Table 1). Table 2 shows the average optic disc brightness score in both the control and TON groups. In the 35 control patients, the temporal quadrant had the highest brightness score, followed by the superior, inferior, and nasal quadrants (4.05, 3.43, 2.93, and 2.31 respectively). The optic disc brightness score significantly differed between the control and TON groups, except in the nasal quadrant (temporal quadrant, p = 0.028; superior quadrant, p = 0.036; inferior quadrant, p = 0.029; nasal quadrant, p = 0.054). According to OCT findings, 6 patients had decreased RNFL thickness levels below the normative 95th percentile. Thinning of the RNFL was most commonly observed (28 of 35 eyes) in the inferior quadrant, which corresponded to a brighter optic disc score (greater than the normative 95th percentile) in the inferior quadrant (Table 3).
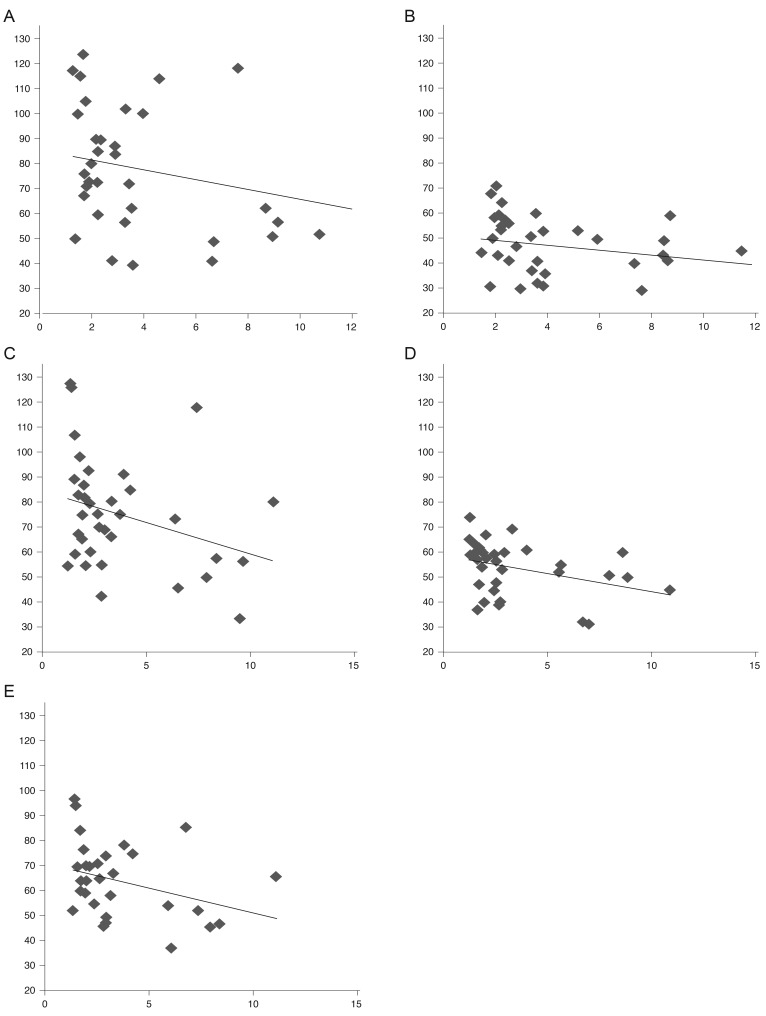
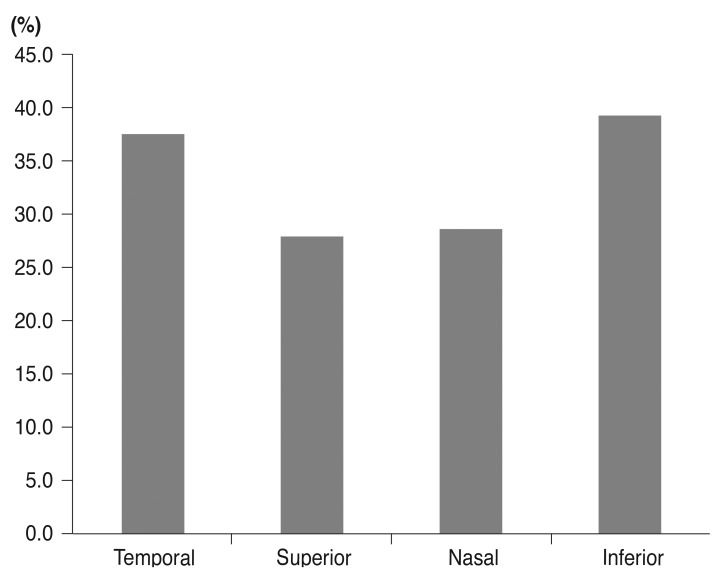
There was a significant negative correlation between optic disc pallor and RNFL thickness in the superior (rho = -0.358, p = 0.04), inferior (rho = -0.345, p = 0.04), nasal (rho = -0.417, p = 0.01) and temporal (rho = -0.358, p = 0.04) quadrants (Fig. 2). The inferior quadrant showed the highest correspondence between optic disc pallor and RNFL thickness values that fell within the 95th percentile of normative data (39.3%) (Fig. 3).
Discussion
This study determined that quantified optic disc pallor using ImageJ significantly correlated with RNFL thickness abnormalities in the TON patients. Reproducibility of RNFL thickness measurements using spectral domain OCT was excellent in both normal and glaucomatous eyes [2]. Moreover, OCT can be used to assess and monitor axonal loss after TON [10]. However, depending on the situation, automated analysis might provide misleading information [11].
In this study, 6 of 35 (17%) patients showed decreased RNFL thickness when the entire retina was examined, but not all individual quadrants were affected. The RNFL thickness most frequently fell below the 95th percentile of normal eyes in the inferior quadrant, reflecting that traumatic damage most often affected the inferior part of the optic nerve. This may be due to typical optic disc histopathology which results in reduced mechanical support for the nerve fibers [12].
Our previous study showed that ImageJ is a useful, objective tool for optic disc color analysis and that it has a high inter- and intra-observer reproducibility [9]. In this report, the gray scale value of the largest inferior retinal vein had a smaller standard deviation than the nasal rim and the brightest cupping center. To minimize intra-observer bias, the brightness value in each quadrant was normalized by dividing it by the largest inferior retinal vein gray scale value. The optic disc brightness was usually highest in the temporal quadrant, which partially corresponded to RNFL thickness measurements. RNFL thickness was largest in the inferior quadrant, followed by the superior, nasal, and temporal quadrants in healthy patients [13]. Additionally, Budenz et al. [2] reported that the nasal quadrant showed the maximum variability in OCT RNFL thickness measurements. The order coincided between each test in our study, based on the assumption that the nasal quadrant also had variable results. The average optic disc brightness score in the TON group was significantly higher than that of controls, except in the nasal quadrant. The optic disc brightness score and RNFL thickness measurements were inversely correlated; optic disc brightness increased as RNFL thickness decreased. The optic disc rim, which is primarily composed of retinal ganglion cell axons, affects the color of the optic disc and, as a result, optic disc pallor occurs when axons have degenerated.
Both RNFL thickness and optic disc pallor values fell within the 95th percentile of normal subjects between 28.0% and 39.3%. Although all control eyes had normal optic disc brightness values, data were highly variable and the standard deviation was higher than in previous OCT RNFL thickness studies. For example, Lee et al. [14]'s study, which reported normal RNFL thickness values in Koreans, had standard deviations less than 20% of mean values, but our study had standard deviations between 60% and 70% of mean values. Therefore, our 95th percentile range of optic disc brightness, shown here, might not be entirely accurate and more normative data would be needed. Additionally, the concordance rate between the two tests ranged from 28.0% to 39.3%, which could be attributed to the small number of controls.
Vilser et al. [15] reported that optic disc pallor measurement using a fundus camera with a color character coupled device camera and a special dual band filter showed a reproducibility rate of 11.7%. In spite of the low reproducibility of the previous study, this study showed that optic disc pallor evaluation in the TON, that used ImageJ software correlated with OCT RNFL thickness findings. Although this correlation was not drastic, ImageJ analysis could be applied as a secondary, objective method to evaluate disc pallor in eyes with TON.
 PDF Links
 PubReader
 Full text via DOI
 Full text via PMC
 Download Citation
 Print
Print


