


Geographic atrophy is known as the end stage of the atrophic age-related macular degeneration without choroidal neovascularization. It presents clinically as a loss of retinal pigment epithelium including overlying photoreceptors and choroidal vessels may be seen more distinctly. Geographic atrophy is estimated to cause 12% to 21% of severe blindness in age-related macular degeneration patients [1,2]. Although enlargement of atrophic lesion is the most commonly used and reproducible methods to assess disease progression, it also correlates with the decrease of visual function.
Typically, atrophic lesions appear first in the perifoveal area, sparing the foveal center, over time these lesions often expand and coalesce to include the fovea [3]. This progression is expected to cause significant visual decline, although visual acuity can decline before the fovea is affected [4,5]. Patients with geographic atrophy may have scotomas, decreased reading speed, reduced contrast sensitivity and low-luminance visual activity, even when central visual acuity is preserved [6-8]. It has been reported that central vision is not completely lost and thus have relatively preserved visual acuity until the atrophic area progresses to more than 80% of the foveal center [9]. This phenomenon is related to the fact that vision may vary according to patient’s ability to find minimally invaded center foveal area [10]. However, these is no conclusive result regarding how topographic progression of geographic atrophy may correlate with visual acuity changes. Therefore, the objective of this study was to find relationship between progression of geographic atrophy and visual acuity decrease, according to the involvement in different circular areas centered on the fovea.
Materials and Methods
Study design
A retrospective medical record review was performed for patients diagnosed with geographic atrophy secondary to age-related macular degeneration between February 2011 and July 2017 at our hospital. This study was performed in accordance with the Declaration of Helsinki. Institutional review board of Kyung Hee University Hospital approved the protocol (2019-05-013), and informed consent was obtained from each subject.
Subjects
Patients over 50 years of age without history of choroidal neovascularization were included in this study. Patients with at least 1 year of follow-up period were reviewed. Patients with atrophy due to high myopia (spherical equivalent >-6 diopters) or due to macular dystrophy were excluded. Patients with dense cataracts or corneal opacity were excluded to provide good imaging quality and analysis. Patients with previous ocular surgery including vitrectomy or pre-existing ocular disease including uveitis, severe glaucoma, and severe diabetic retinopathy were also excluded from this study.
Retinal imaging procedure
Geographic atrophy was defined as discrete areas measuring more than 500 mm of loss of retinal pigment epithelium with a color and thickness change relative to the surrounding retina with more prominent visualization of choroidal vessels. Atrophic area was measured based on fundus autofluorescence (FAF; 30 × 30 degrees and 768 × 768 pixels; Spectralis HRA-OCT, Heidelberg Engineering, Heidelberg, Germany). Color fundus photography and optical coherence tomography (Spectralis HRA-OCT) were used to determine the involvement of central fovea.
Image analysis and software
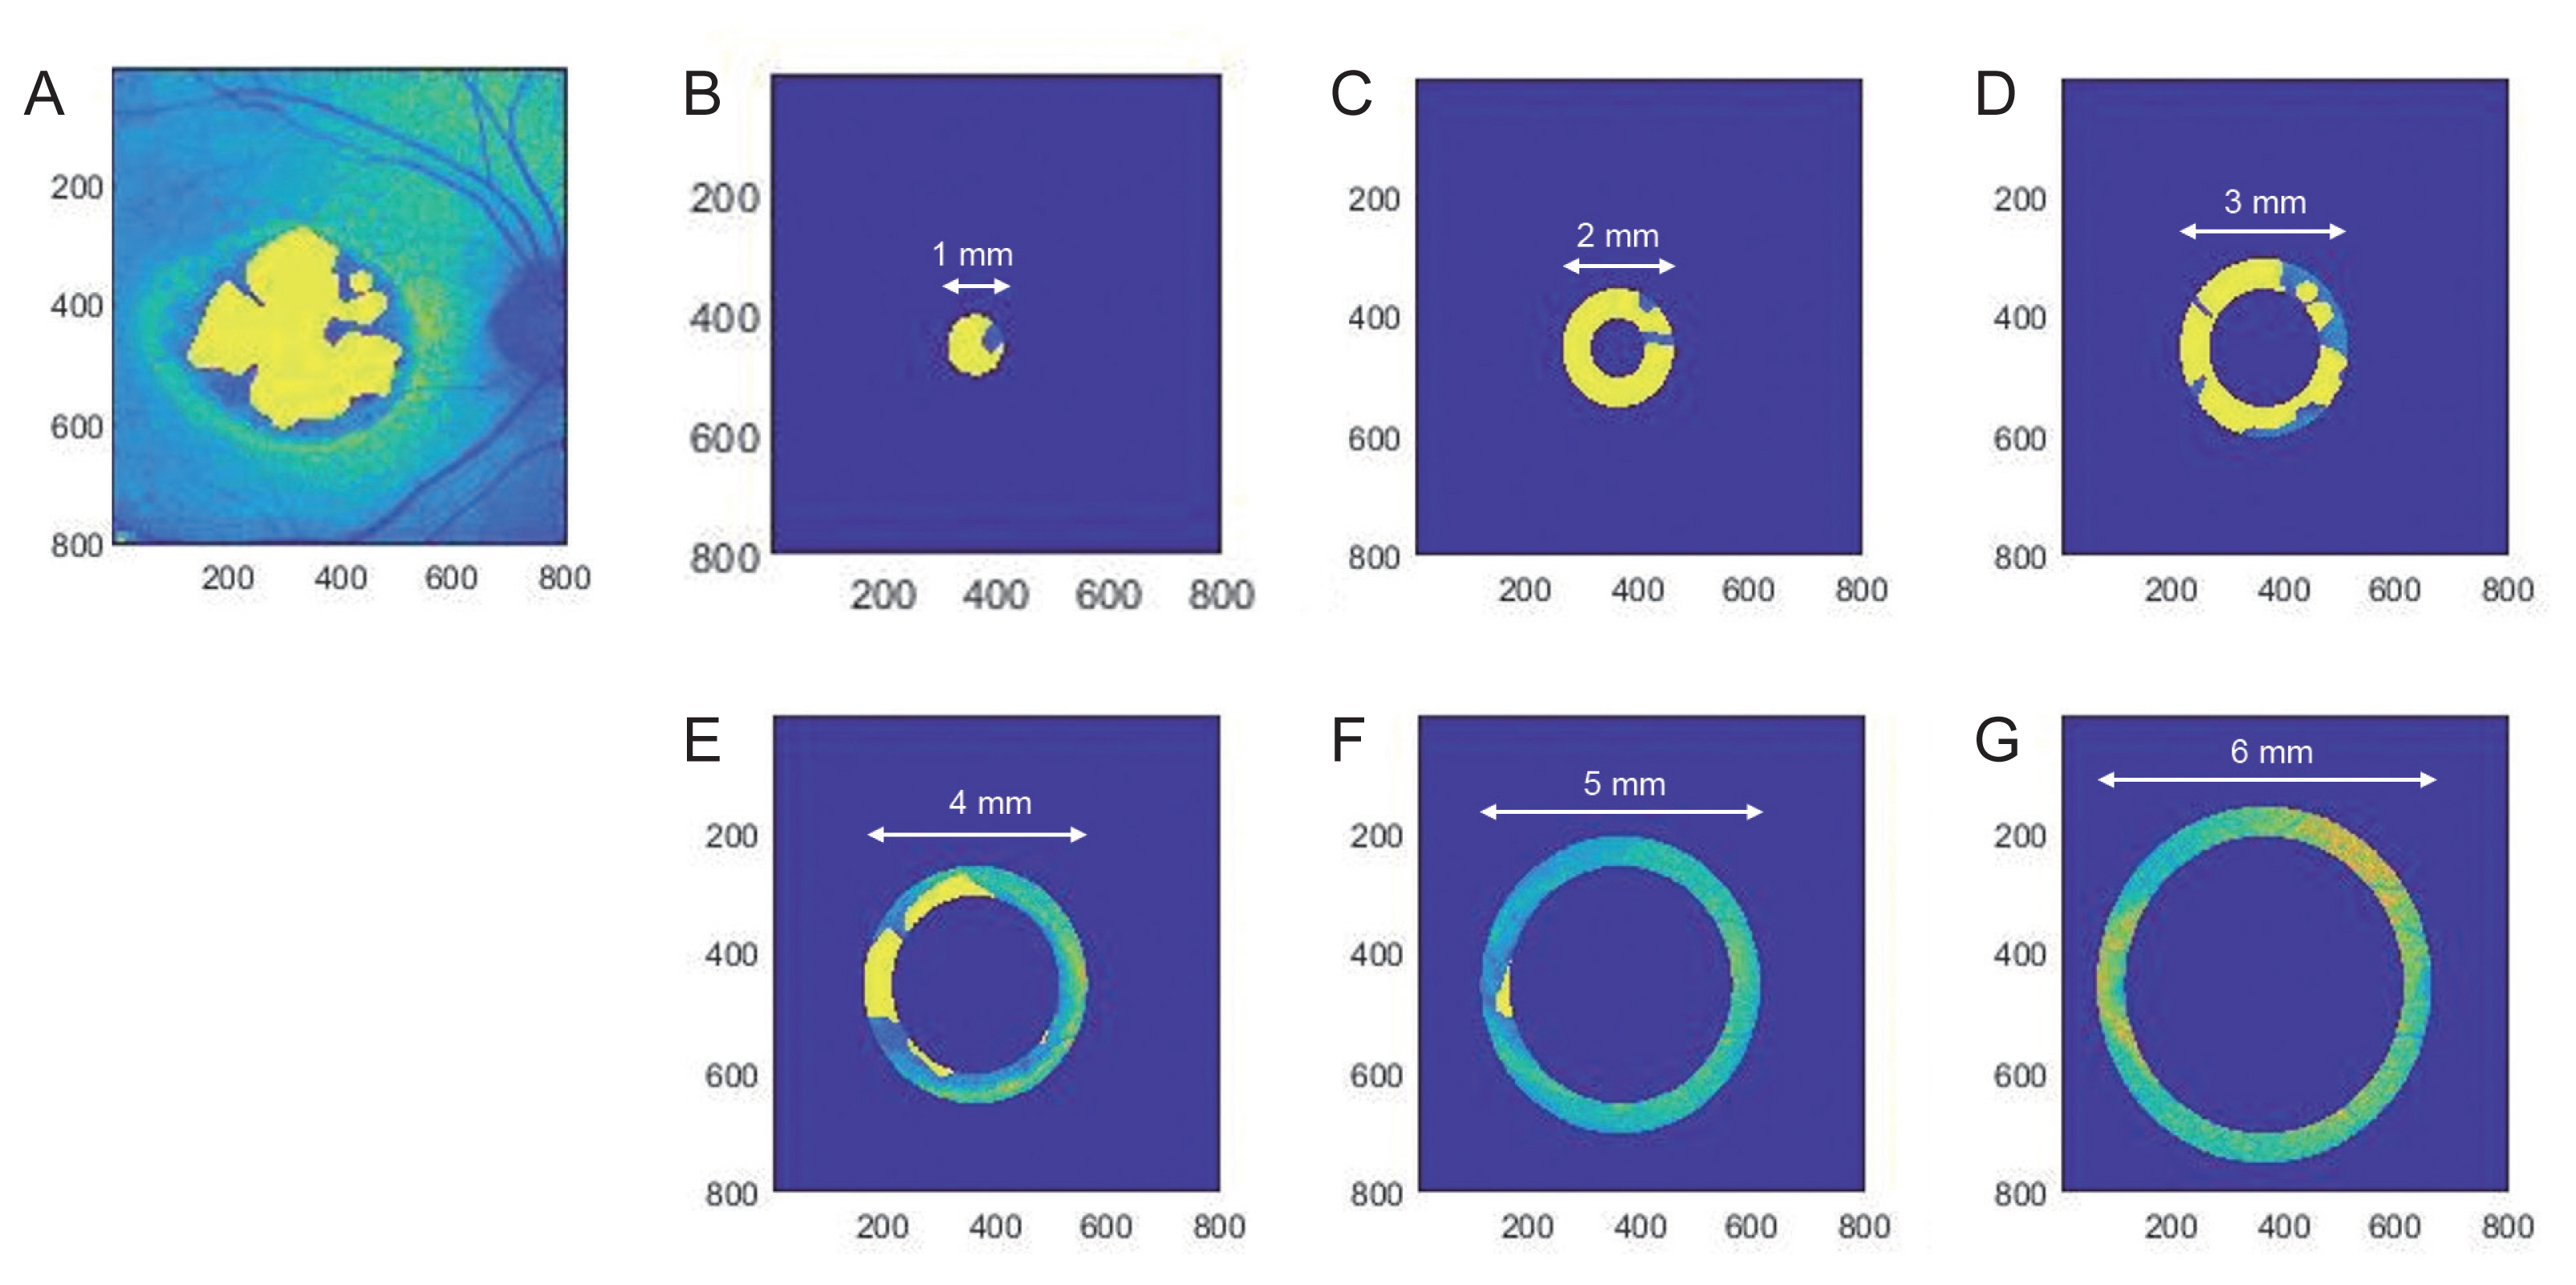
Geographic atrophy area was measured manually using ImageJ ver. 1.48 (National Institutes of Health, Bethesda, MD, USA; http://imagej.nih.gov/ij/) and calculated with MATLAB ver. R2013b (The MathWorks, Natick, MA, USA). Zone 1 (fovea) was defined circle with 1 mm diameter centered on the fovea. Then, zone 2 to 6 were defined as doughnut-shaped area around fovea divided by concentric circles each with increase in diameter from 1 to 6 mm (Fig. 1A-1G). Total atrophic area and atrophic area in each zone were measured twice by one physician on two different dates and their average value was obtained.
Examination protocol
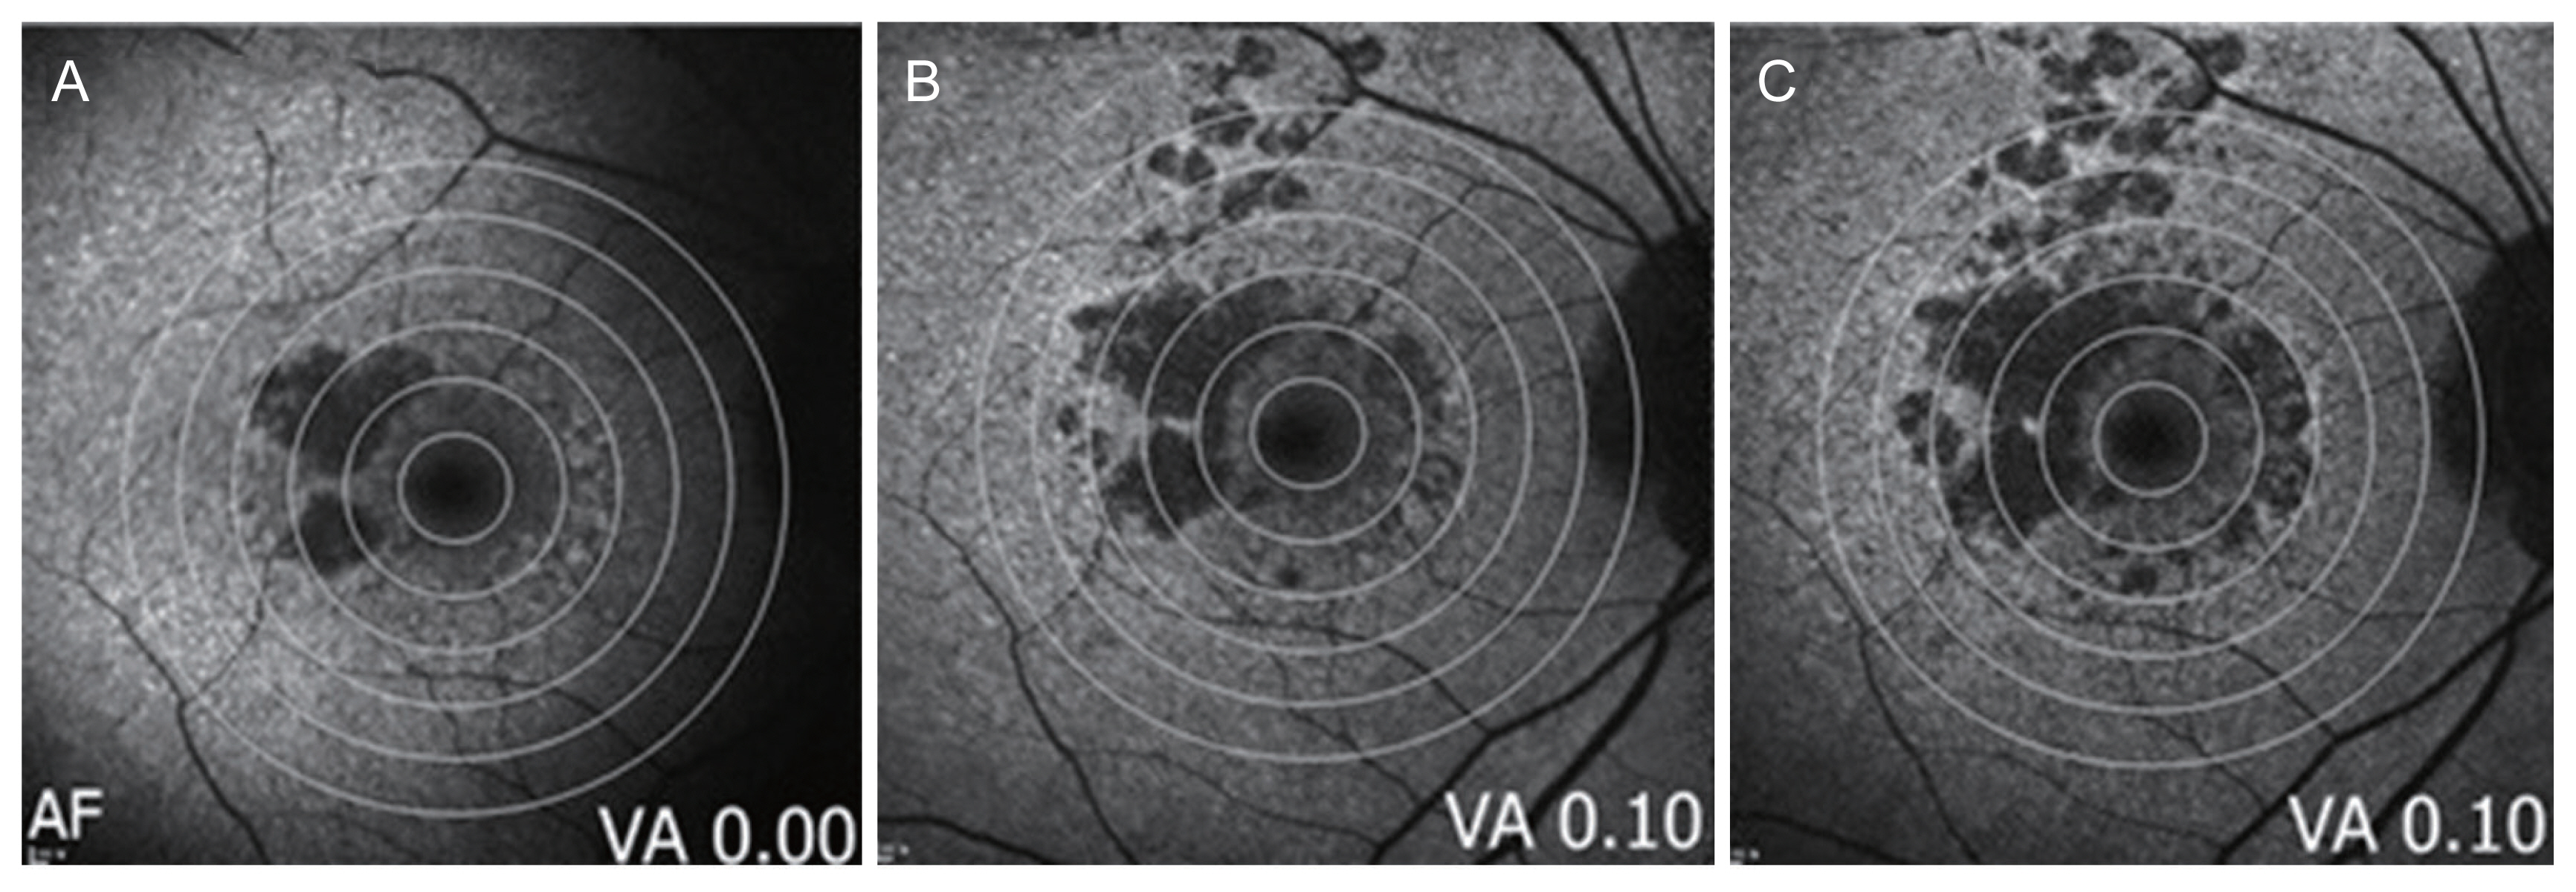
A full ophthalmic examination was performed, including best-corrected visual acuity (BCVA) using decimal chart at 4 m, slit-lamp examination, fundus photography, FAF, and optical coherence tomography (OCT) in each visit. BCVA was converted to logarithm of the minimal angle of resolution equivalent. BCVA and change of atrophic area were then analyzed annually (Fig. 2A-2C).
Statistical analysis
Descriptive statistics were used for each area of atrophic region over time and BCVA. Relation between area and BCVA was described using mixed model analysis of covariance and generalized linear model. All statistical analyses were performed using PASW SPSS ver. 18.0 (SPSS Inc., Chicago, IL, USA). A p-value of <0.05 was considered statistically significant for all analyses.
Results
A total of 36 eyes of 26 patients with geographic atrophy secondary to age-related macular degeneration were analyzed. Mean age of patients was 76.90 ± 7.90 years and mean follow-up period was 3.38 ± 1.57 years (Supplementary Table 1, 2). Among all patients, visual acuity was significantly decreased from 0.39 ± 0.40 to 0.69 ± 0.64 logarithm of the minimal angle of resolution during the follow-up period (p < 0.001). The atrophic area was measured twice and intraclass correlation was analyzed. Based on intraclass correlation coefficient, there was a high degree of accuracy of atrophic area on each zone (intraclass correlation coefficient >0.93) (Supplementary Table 3). Therefore, we assumed atrophic region by averaging two areas.
Progression of atrophy area
Atrophic area of each eye was compared from initial visit to the last visit. During follow-up period, atrophic area increased from 8.09 to 16.34 mm2 and progression rate of total geographic atrophy area was 2.44 mm2/yr. Atrophic area of 1 mm from foveal center increased from 0.07 to 0.10 mm2. Rate of progression increased when distance from foveal center was increased. For example, 6 mm from foveal center showed the most rapid progression of atrophic area. Even if area of each region was standardized, rate of progression increased in the peripheral atrophic area (Table 1).
Correlation between topographic progression of atrophy and BCVA changes
Causal relationship of change in atrophic area with BCVA during follow-up period was analyzed by analysis of covariance after adjusting for year, initial atrophic area, initial visual acuity, each patient, and patient’s eyes. Changes in total atrophic area was not significantly correlated with decrease of BCVA (p = 0.108). However, zone 1 to zone 3 showed significant relationships with change of visual acuity. Zone 1 (correlation coefficient, r = 0.54) and zone 2 (r = 0.61) showed more relevant causal relationship with change of vision than zone 3 (r = 0.44). Whereas zone 4 to zone 6 showed insignificant correlation with change of BCVA (Table 2).
Causal relationship between change of atrophic area and BCVA was analyzed using generalized linear model. Among divided zones, zone 2 to zone 4 showed relationship with change of visual acuity. Zone 2 had the most relevant relationship with visual change (r = 0.73, p < 0.001) (Supplementary Table 4).
Discussion
Geographic atrophy is an irreversible, progressive vision-threatening disorder, and there has been no satisfactory method for rating disease severity affecting individual’s visual function. In the most recent Chroma and Spectri study, correlation coefficients between geographic atrophy lesion size and visual function showed moderate to poor associations [11]. Therefore, we evaluated progression of geographic atrophy on dividing area according to the different size of concentric circles from fovea and attempted to find their correlations with the decrease of visual acuity.
Overall, progression rates of geographic atrophy were reported in the literature for study populations range from 0.534 to 2.64 mm2/yr [12,13]. Our research showed that the progression rate of geographic atrophy was 2.44 mm2/yr, which was comparable with that of previous studies. In addition, risk factors for faster rates of geographic atrophy lesion enlargement was identified as larger baseline lesion size and extrafoveal location, in Chroma and Spectri study [11]. Similarly, progression of geographic atrophy was observed be faster with increasing distance from the foveal center in the present study.
In this study, we focused on causal relationship between progression of geographic atrophy in specific area and change of vision. Consistent with previous reports, change in total atrophic area was not significantly was correlated with visual changes. However, after adjusting for initial factors including initial area and initial visual acuity, significant relationship between geographic atrophy progression and visual acuity was observed in zone 1, 2, and 3 defined as parafoveal area. To the best of our knowledge, this is the first long-term study aimed to evaluate growth rate of geographic atrophy in Korean population. Also, we firstly reported to reveal geographic atrophy progression in divided concentric circular areas associated with change of vision.
Photoreceptor layer on fovea is consisted of entirely cone cell. It is also known as the most important area of maximum visual acuity. In that sense, progression of geographic atrophy in zone 1 (1 mm from foveal center) had a strong effect on decrease of visual acuity. Interestingly, zone 2 (1 to 2 mm from foveal center) had the strongest correlation with visual acuity. The effect of progression in atrophic area on visual acuity gradually decreased from parafoveal to perifoveal area. This phenomenon can be related to characteristic of autofluorescence image to detect lipofuscin. The maximum intensity on parafoveal region decreases towards the retina periphery on autofluorescence image [14]. Lower intensity on foveal center is due to foveal luteal pigment absorbing blue light [15]. Moreover, higher melanin granule and lower lipofucin granule in central retinal pigment epithelium are associated with lower intensity [16]. Therefore, single autofluorescence image is not suitable to evaluate degeneration on foveal center. On the other hand, degeneration in the parafoveal region can be easily detected due to higher intensity on autofluorescence. Although we carefully measured atrophic area of foveal center by using multimodal image including fundus photography and OCT, we could not exactly measure damage of specific cell type by using these images. Consequently, the inconsistency of clinical image of atrophic area over degeneration on cellular level can be one reason for explaining the importance of parafoveal area over foveal center.
It is well-known that parafoveal region can support central vision and visual acuity. Rods are known to produce diffusible substance essential for cone survival [17,18]. If rods are mostly present in the parafoveal area, parafoveal region can affect visual acuity. Geographic atrophy lesions may grow into foveal surrounding horseshoe or ring shapes [5]. It was hypothesized that preferential foveal sparing reflects the relatively lower susceptibility of cone versus rod photoreceptors to cell death [19,20]. Recently with the development of OCT angiography, degeneration areas of geographic atrophy are found not only on photoreceptor and retinal pigment epithelium, but also on choriocapillaris, the innermost layer of choroid [21]. Choriocapillaris is known to support retinal pigment epithelium and photoreceptor layer. In that case, microvascular degeneration of geographic atrophy over parafoveal area can induce decrease of visual acuity over time. A recent study has revealed the association of parafoveal area and visual acuity [22,23]. Sandberg et al. [17] have reported that visual acuity is not only related to foveal area, but also related to parafoveal retinal thickness in retinitis pigmentosa. Another study has revealed the correlation of change in microvascular structures with visual acuity in retinal vein occlusion by using OCT angiography [23]. In this report, superficial foveal avascular zone and parafoveal vascular density are correlated with visual acuity in retinal vein occlusion. In that sense, further study will be needed to find the relationship of microvascular degeneration and atrophic area correlating with visual change.
This study has some limitations. First, the number of patients and eyes involved was relatively small and follow-up period was not consistent. Secondly, due to the retrospective nature of this study, only BCVA was explored to estimate visual deficit in geographic atrophy. It is recognized that BCVA often underrepresents functional deficits, especially in those patients with foveal sparing-lesions [24]. Other studies have evaluated correlations between geographic atrophic lesion area and alternative measures of visual function, such as, low-luminance visual acuity, microperimetry, and reading speed. Thirdly, geographic atrophy size was evaluated using FAF imaging, which visualizes decreased autofluorescence. Loss of the photoreceptor components or choriocapillaris may not show as abnormalities on FAF, and thus the use of FAF-detected geographic atrophy area may not appropriately reflect the true extent of cell death or dysfunction and thus may not correlate as well as may be expected with decline in visual function [25,26]. Also, due to fovea absorbing blue light autofluorescence, measuring foveal involvement in the presence of geographic atrophy by short-wavelength FAF alone may be challenging [3]. Therefore, we used other imaging modalities including color fundus photo and OCT in confirming lesion boundaries. However, the degree of precision wtihin measured atrophic area around the fovea can affect the validity of progression of zone 1.
Currently, many factors potentially prognostic for geographic atrophy progression have been identified, yet imaging parameter for rating an individual’s severity is limited, particularly those affecting visual function. For example, although lesion size is known to be important, the degree of foveal involvement and impact of parafoveal lesions are critical to determining geographic atrophy lesions to visual acuity. Therefore, our results suggested that geographic atrophy progression including parafoveal area, especially within 3 mm from foveal center, had significant correlation with visual acuity, in contrast to the progression of total atrophic area. Geographic atrophy progression within parafoveal area should carefully be monitored for decrease of vision. Further study would be warranted to understand how this topographic involvement of geographic atrophy exactly interact and relate to the central visual function.
 PDF Links
 PubReader
 ePub Link
 Full text via DOI
 Full text via PMC
 Download Citation
 Supplement1
 Print
Print


