


The retinal arterial system nourishing the inner two-thirds of the retina and the choroidal arterial system nourishing the outer retinal layers are of great importance for vision and normal retinal function [1]. Hence, the structural, physiological and functional integrity of these two circulations deserves to be examined and analyzed, leading to observe changes that occur with increasing age and leading to shedding light on the pathogenesis of various kinds of retinal and choroidal diseases [2,3].
Optical coherence tomography angiography (OCTA) is a three-dimensional non-invasive imaging method that enables to visualization of both retinal and choroidal vasculature. Split-spectrum amplitude-decorrelation angiography associated with OCTA is a developing computer system that can delaminate the vascular layers of the retina and choriocapillaris in the macular region. Also, it provides visualization of the vascular network without injecting a dye in the peripapillary region of the optic nerve head [4,5]. OCTA has greatly enhanced our knowledge of retinal and choroidal pathology. However, despite all these developments, OCTA is still not enough to generate a normative database related to age, sex, and race.
Our study aimed to determine the potential effects of age and sex-related differences on the superficial macula whole-image vessel density (wiVD), foveal VD and parafoveal VD, foveal avascular zone (FAZ) as well as choriocapillaris flow index (CFI) in healthy volunteers using OCTA with the split-spectrum amplitude-decorrelation angiography algorithm.
Materials and Methods
Our study was carried on healthy volunteers who did not have any ophthalmologic or medical event in the past and had normal fundus finding. The subjects were either who attended the clinic with the mild ocular problem, such as mild dry eye syndrome or allergic conjunctivitis or those who wanted to do routine check-up in their eyes. The ethics committee of Dokuz Eylul University, School of Medicine approved the study protocol (2015/01-21) and informed consent was obtained from all the participants. All participants underwent OCTA imaging using the AngioVue OCTA system (Optovue, Fremont, CA, USA) at Dokuz Eylul University, School of Medicine, Department of Ophthalmology. All measurements were analyzed prospectively. Best-corrected visual acuity (BCVA) with Early Treatment Diabetic Retinopathy Study chart; slit-lamp biomicroscopy; intraocular pressure (IOP) measurement with non-contact air-puff tonometer; a dilated fundus examination with a binocular indirect ophthalmoscope were performed in all individuals. The measurements of axial length were performed by using IOLMaster 500 (Carl Zeiss Meditec AG, Jena, Germany).
The inclusion criteria were subjects aged 20 years or older, with BCVA of 20 / 25 or better, SE within ┬▒3.0 dipoters (D), cylinder correction within ┬▒1.5 D and normal axial length (range, 22-24 mm). The patients were excluded in case of BCVA <20 / 25, ocular hypertension, glaucoma, prior history of ocular trauma or surgery, retinal vascular diseases, diabetes mellitus, hypertension, and cardiovascular disease.
Imaging with XR Avanti
In all individuals, pupils were dilated with 1% tropicamide and 2.5% phenylephrine hydrochloride eye drops before the fundus examination and image acquisition. The AngioVue OCTA system (Optovue) was used for imaging. Images with a signal strength index less than 40 were excluded due to the poor quality. Automatic segmentation was performed the superficial capillary plexus 3 ╬╝m below the internal limiting membrane to 15 ╬╝m below the inner plexiform layer (IPL) and the deep capillary plexus 15 to 70 ╬╝m below the IPL. The outer retina was localised as 70 ╬╝m below the IPL and 30 ╬╝m below the retinal pigment epithelium (RPE). The choriocapillaris layer was described from the RPE with an offset (from the RPE reference) of 30 ╬╝m to the deeper choroidal layer with an offset (from the RPE reference) of 60 ╬╝m. FAZ area was measured in mm2 only at the end of the second session.
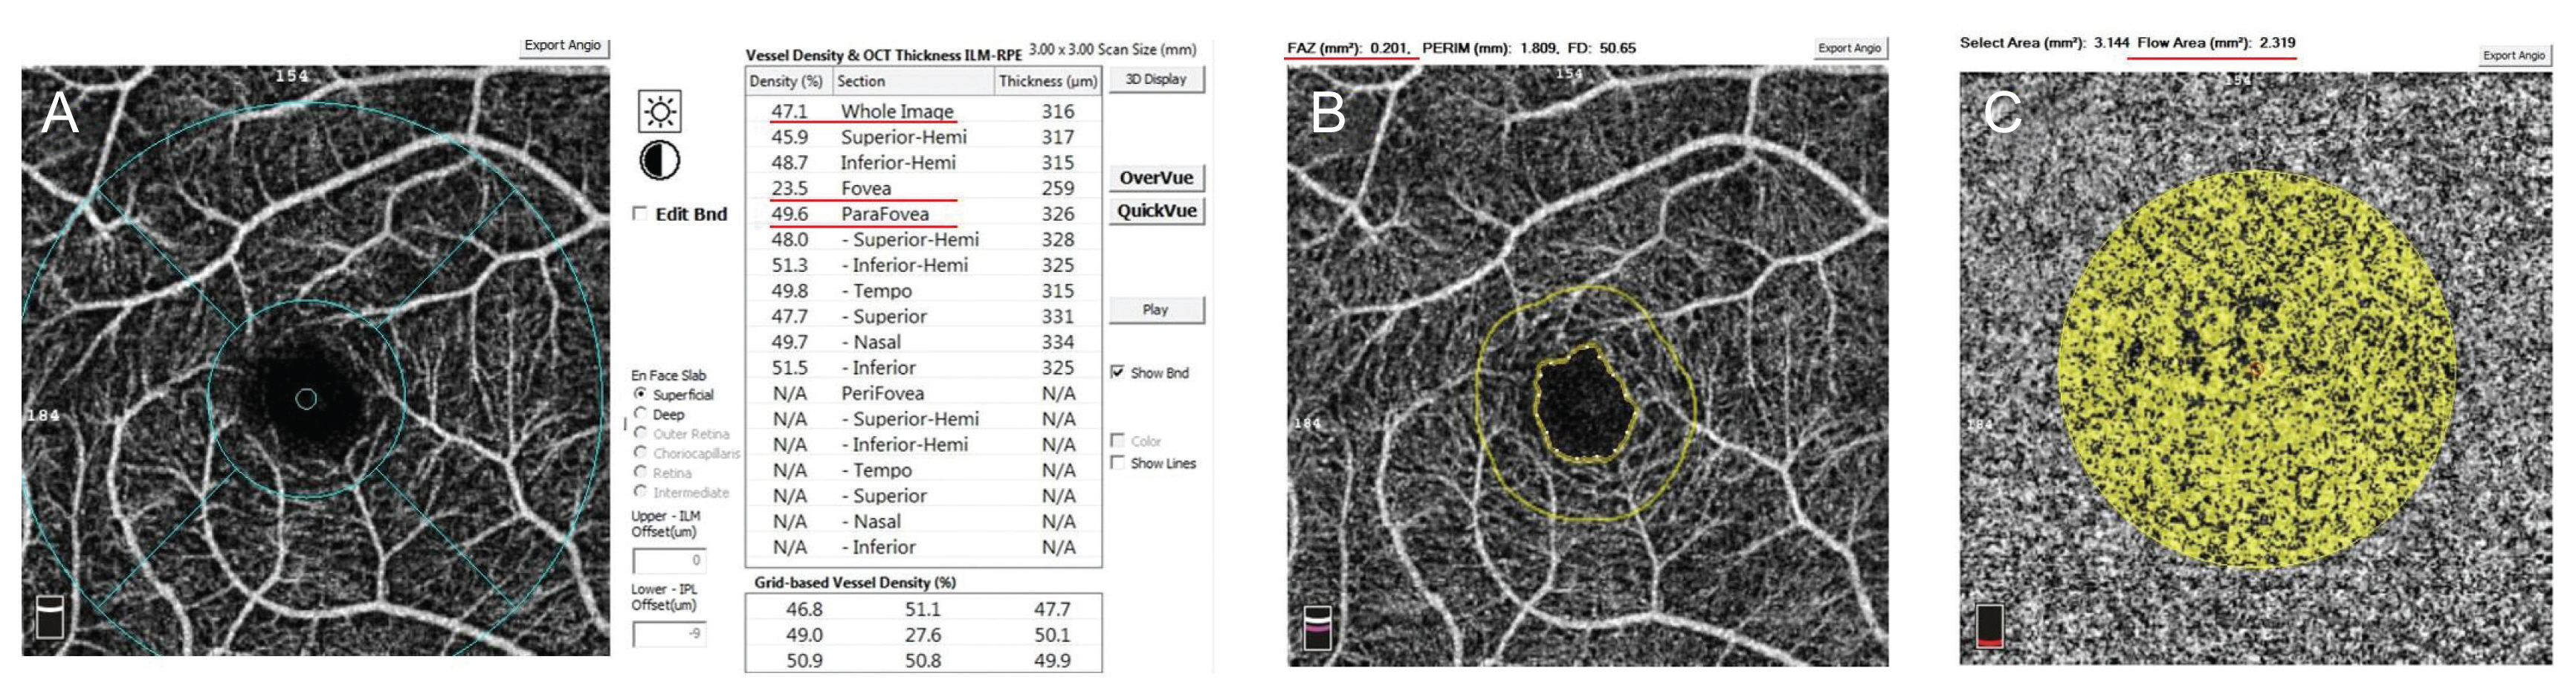
The OCTA Angiovue analysis software automatically calculates vessel density as the percentage (%) of the measured area occupied by flowing blood vessels defined as pixels having decorrelation values above the threshold level. Only superficial retinal capillary plexuses 3 ├Ś 3-mm image for macula vessel density was used in the analysis. Whole-image vessel density (wiVD), foveal VD and parafoveal VD were measured in the entire en-face 3 ├Ś 3-mm image (Fig. 1A-1C).
Statistical analysis
Statistical analysis was performed using IBM SPSS ver. 20.0 (IBM Corp., Armonk, NY, USA). All the participants were divided into four groups according to their ages: group 1 (20-29 years), group 2 (30-39 years), group 3 (40-49 years), and group 4 (50-60 years). Descriptive statistics were calculated as the mean and standard deviation. Analysis of variance and post hoc Tukey honestly significant difference test was performed to compare mean values among the individuals according to the classification of age groups. An independent t-test was used to compare the angiographic parameters between the female and male. The association between age and signal strength index were tested by performing Spearman correlation coefficient and linear regression models. A p-value less than or equal to 0.05 were considered statistically significant.
Results
A total of 208 eyes of 104 healthy Turkish individuals was enrolled in the study. Demographically, our study sample consisted of 54 females (51.9%) and 50 males (48.1%); the mean age of subjects was 40.35 ┬▒ 12.64 years (median, 36.0; range, 20-60 years). All subjects were grouped into four age groups ranging from 20 years to 60 years. Table 1 shows the demographic and clinical characteristics of the enrolled individuals.
Results of wiVD, foveal VD, parafoveal VD, FAZ, and CFI for all age groups are summarized in Table 2. The average wiVD, foveal VD and parafoveal VD in the superficial retinal capillary network for all subjects was 53.1% ┬▒ 2.8% (range, 39.94%-58.18%), 31.7% ┬▒ 6.9% (range, 14.74%-56.24%), and 55.2% ┬▒ 3.4% (range, 31.99%-60.66%), respectively. The mean area of the FAZ in the superficial retinal vascular layer measured in all subjects was 0.313 ┬▒ 0.112 mm2 (range, 0.066-0.630 mm2). The mean CFI for all subjects was 1.937 ┬▒ 0.059 (range, 1.623-2.085). All wiVD, foveal VD, parafoveal VD, FAZ and CFI measurements were not statistically significant since comparing fellow eyes (for all, p > 0.05). wiVD, foveal VD and CFI indices were similar between males and females, as shown in Table 3 (p > 0.05). However, the parafoveal VD was significantly higher in females than males (p = 0.027). Moreover, the FAZ area showed sex differences with a mean of 0.306 mm2 in females and 0.265 mm2 in males (p = 0.015).
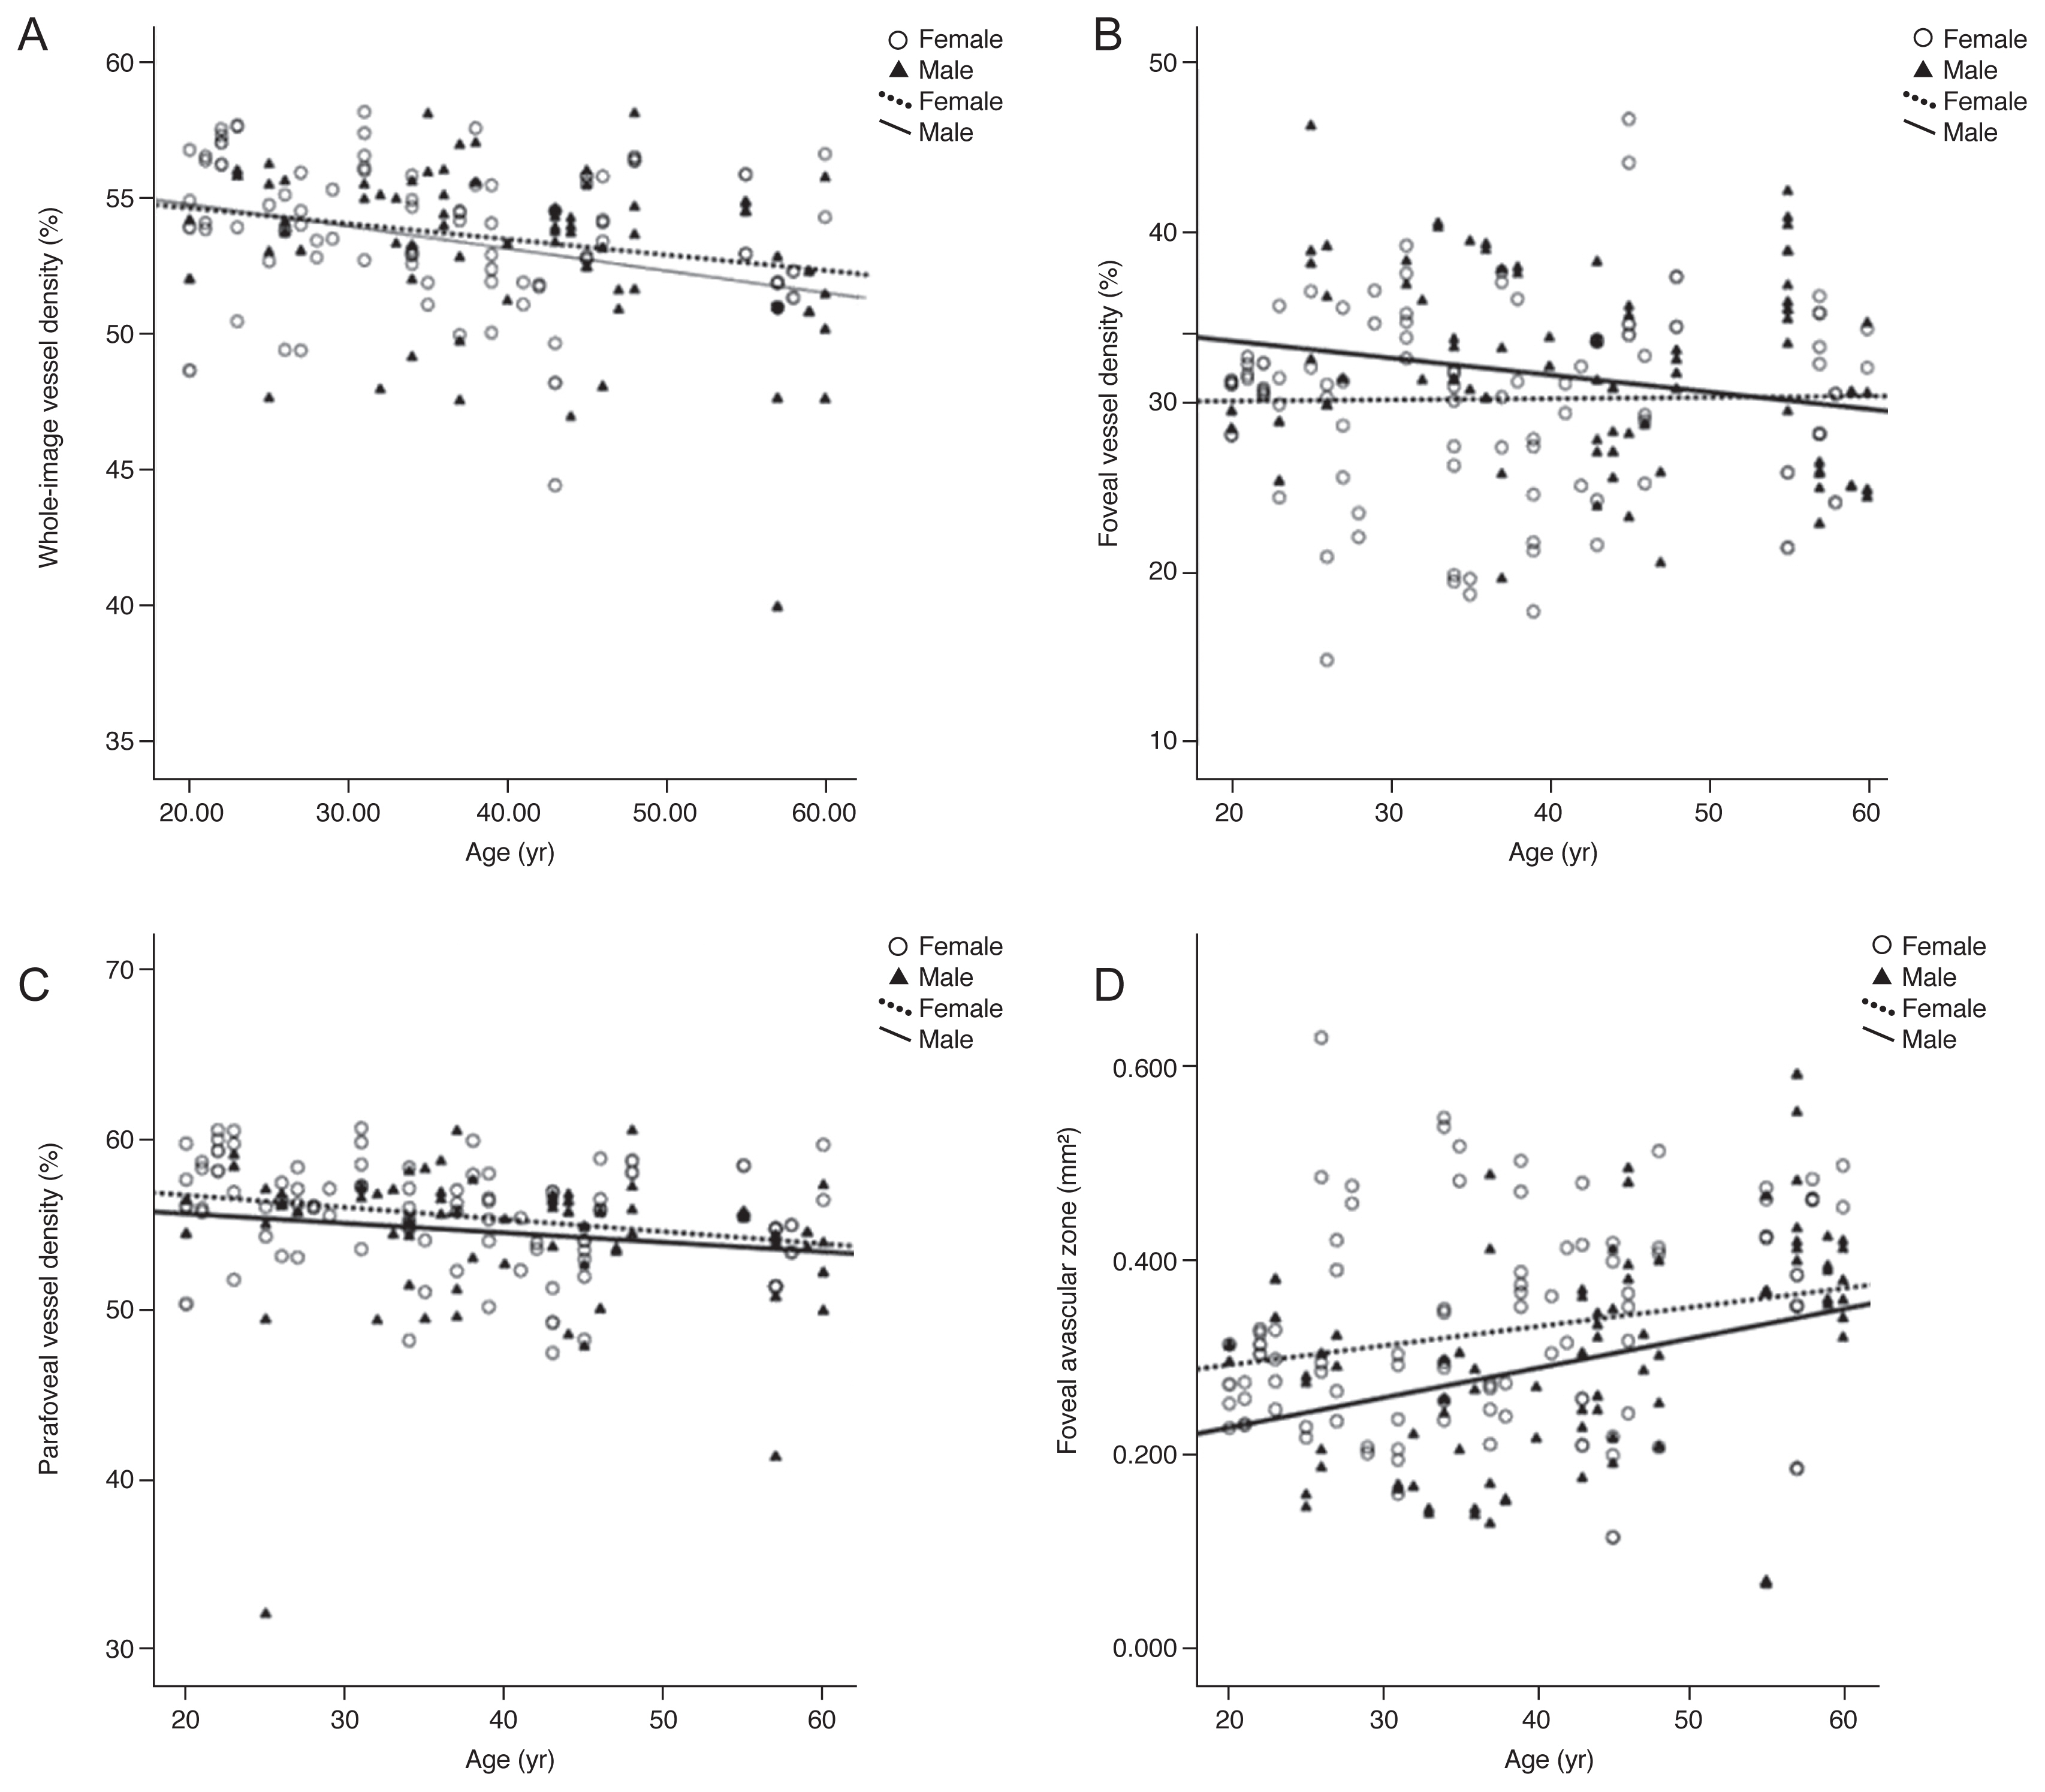
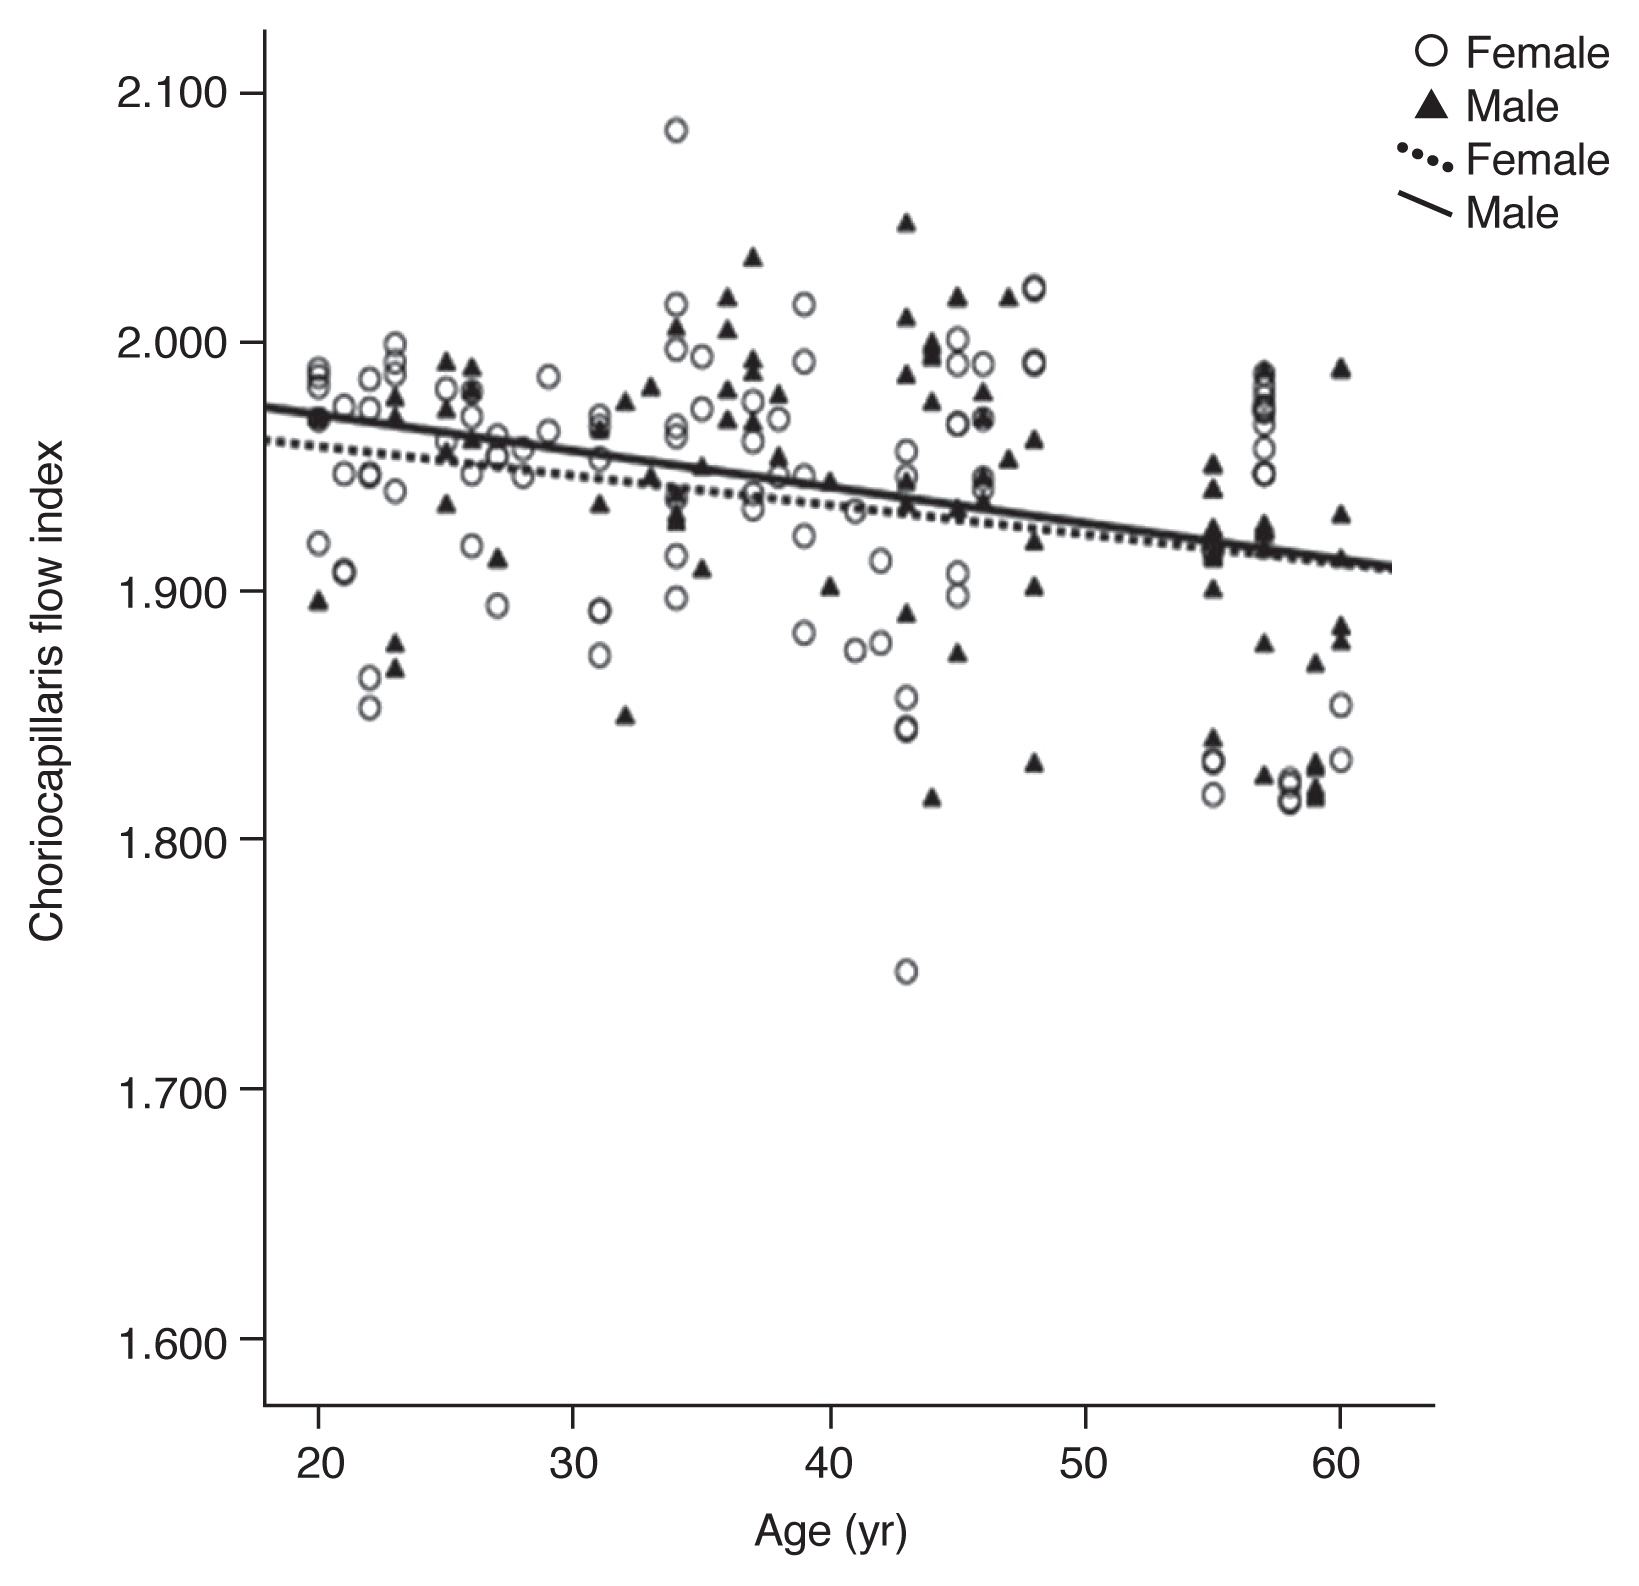
A significant trend was noted toward decreasing mean wiVD, parafoveal VD and CFI values with increasing age (p < 0.001, p = 0.001 and p < 0.001, respectively) (Fig. 2, 3), revealing yearly average decreases of 0.3%, 0.4% and 0.4%, respectively. However, there was no statistical relationship between increasing age and foveal VD (p > 0.05). The FAZ area increased with increasing age (Fig. 2), showing an average annual increase of 1.26%. In addition, there are significant differences among different age groups (p = 0.004). Males had a greater increase than females in the FAZ area with age.
Linear regression analysis showed a negative association of mean wiVD (r2 = ŌłÆ0.31, p < 0.001), parafoveal VD (r2 = ŌłÆ0.25, p < 0.001), and CFI (r2 = ŌłÆ0.28, p < 0.001) with age. There was a positive association of mean CFZ (r2 = 0.21, p = 0.003). However, no correlation was found between mean foveal VD (r2 = 0.13, p = 0.069) and increasing age.
The mean intraclass correlation coefficient between two measurements from 34 eyes was 0.922 for wiVD, 0.954 for foveal VD, 0,936 for parafoveal VD, 0.956 for CFI, and 0.942 for FAZ area; a Bland-Altman plot showed good agreement (Fig. 1A-1C). There was a high value of intraobserver repeatability and interobserver reproducibility of 0.996 and 0.998, respectively, for evaluating the measurement of mean intraclass correlation coefficient in the FAZ area.
Discussion
In the current study, we examined the macular and choroidal perfusion in healthy Turkish individuals using OCTA images, based on measurements of central 3 ├Ś 3-mm superficial macula wiVD, foveal VD and parafoveal VD, FAZ area, as well as CFI. This study is the first of its kind to define detailed age and sex on normative OCTA data from the retinal vascular density, FAZ and CFI. Our findings revealed a significant negative correlation between age and wiVD, parafoveal VD, and CFI. This study demonstrated normative OCTA data from healthy subjects at different age groups and documented that wiVD, parafoveal VD and CFI decreased with age, whereas the FAZ area increased with increasing age. However, there was no association of foveal VD with increasing age. The measurements differ significantly between studies. This variability may be explained by differences in the study population (including age range, and ethnicity), the relatively small sample size, study devices and software, or methods of measurements, and the deviceŌĆÖs version. Another possible explanation is that there is no retinal nerve fiber layer in the fovea, superficial layer VD may be too scarce to be detected by OCTA in that layer, which may lead to minimal change with ageing. In the present study, it was also found that a gradual and significant decline begins around age 40 for the whole-image vessel density, whereas the opposite increased in the FAZ area. Moreover, a significant decrease was found in parafoveal VD and CFI after 40 years of age, or especially after 50 years of age.
OCTA presents not only structural but also functional (i.e., blood flow) information simultaneously [6-9]. Intriguingly, it allows detecting changes in retinal and choroidal blood vessel flow before the clinically meaningful changes observed [10]. Also, it helps in the management of important ophthalmologic diseases such as diabetic retinopathy, age-related macular degeneration (AMD) [11,12], central serous chorioretinopathy [12], retinal vascular occlusions [13], and sickle cell disease [14]. Besides, racial variability is a well-known fact for the device when evaluating some diseases such as diabetic retinopathy, AMD, and glaucoma. Unlike racial variability knowledge in OCTA, there is very limited information about the normative database and its applicability in retinal and choroidal pathologies. Moreover, there is an obvious need for normative data which acknowledge race- or sex-related contributing factors in retinal and choroidal anatomy including macula or optic nerve. The interpretation of OCTA measurements of macular and choroidal perfusion could be improved with a better understanding of race-, age-, and sex-associated differences with the underlying mechanisms causing the differentiation.
Previous studies have demonstrated a decrease in macular perfusion regarding an enlargement in the FAZ area with increasing age [15-21] which is consistent with our study. Yu et al. [15] found a decrease in the superficial retinal capillary plexus parafoveal flow index and vessel area density with increasing age at a rate of 0.6% and 0.4% per year, respectively; that decreased more rapidly in male than in female subjects. Our results showed that the FAZ was larger in females than in males. Further, in this study, the mean superficial parafoveal VD was higher in females (55.4%) than in males (54.3%). These results agreed with the study from You et al. [22] and Rao et al. [23]. Conversely, Borrelli et al. [24] and Wang et al. [19] reported a higher superficial vessel density in males than in females. Shahlaee et al. [16] reported no sex difference for macular vascular density measurements. The reason for the sex discrepancy among these studies remains unclear. Vandewalle et al. [25] reported that tissue loss and related decrease in metabolic demand could cause changes in perfusion and a corresponding reduction in retinal blood supply. Such a decrease in ocular microcirculation could impair the delivery of oxygen and nutrients, and the removal of metabolic waste, making the retina more susceptible to diseases. Shahlaee et al. [16] demonstrated a negative correlation between foveal and parafoveal vascular density values with age which is compatible with the increased FAZ and decreased parafoveal flow. Besides, Wang et al. [19] found that increasing age was associated with the decrease in vessel density in the superficial retinal capillary plexus, whereas the FAZ as measured in the superficial retinal vascular layer was not significantly associated with an increase in age and sex. Samara et al. [26] also reported no significant association of age with the FAZ area. Methods used for measurements, differences in ethnic background and each decade of life can contribute to these discrepancies.
Choroidal blood supply is reported to be correlated with retinal diseases, crucial causes of vision loss or impairment, such as AMD [27] and diabetic retinopathy [28]. Therefore, it is of importance to visualize the vasculature and blood flow in the choriocapillaris and the capillary layer of the choroid. Previous studies reported that choroidal hemodynamics (mean arterial pressure or ocular perfusion pressure) only significantly correlated with age [29,30]. Emeterio Nateras et al. [31] reported that magnetic resonance imaging-choroidal blood flow was negatively correlated with age, declining 2.7 mL / 100 mL/min per year. Ito et al. [32] also found that the number of choroidal arterioles and the indocyanine green angiography fluorescent intensity in the macular region decreased with age in individuals older than 50 years. As similar to the previous studies, our results show that the CFI declines with advancing age at a rate of 0.4% per year. Thus, age-dependent factors in choroid may involve in the etiopathogenesis of AMD, found mostly in the elderly.
The present study has several strengths. The study cohort consists of a relatively high number of healthy individuals and including normative data across four decades of life, very good quality of an imaging method with perfect capillary resolution and reproducibility. Our study has also some limitations. This study reported on a single capillary plexus layer and FAZ for each eye. Recently, separate vascular density values and FAZs for each of the capillary plexuses are being reported. Distinguishing the plexuses into different segments at the FAZ margin may give rise to additive dependent conditions in the measurements.
Nevertheless, there are limited data available comparing macular perfusion in different racial/ethnic groups; however, the existing data suggest differences in macular perfusion. Population groups with difference determined by ethnicity show differences in terms of illness behaviour and beliefs. Normative values in different ethnicity are needed to better understand diseases pathogenesis. Therefore, data documenting normal macular area measurements in healthy Turkish subjects are imperative to clinicians to help them make informed decisions on pathologic changes in this ethnic group. The clinical applications of OCTA have recently increasingly expanded so normal reference values for macular and choroidal perfusion are needed at different age groups where the OCTA has no nomogram for comparison.
In conclusion, age and sex differences were found to be associated with the normative values of the vessel area density at the foveal, parafoveal and FAZ area obtained by a commercially available OCT system ver. 2015.1.1.98 (Optovue) that supplies high-quality angiograms of the macula and choroid. Moreover, the CFI decreases with increasing age. Thus, dependent factors such as age and sex should be kept in mind while performing further researches on macular and choroidal perfusion. These normative values may be helpful when using OCTA in the diagnostic investigation of the disorders of retina and choroid.
 PDF Links
 PubReader
 ePub Link
 Full text via DOI
 Full text via PMC
 Download Citation
 Print
Print


