

It is important to assess the morphology of the optic disc carefully when screening for, diagnosing, and monitoring glaucoma. Among the several morphological features of the optic disc that we look for when glaucoma is suspected, the vertical cup-to-disc ratio (CDR) is one of the most commonly used parameters in the clinical setting [1].
However, large CDR can occur not only in glaucoma patients, but also in the normal healthy population. In addition to glaucoma, there are systemic and ocular factors that may affect CDR, and investigating these factors may be important for understanding elongation of the optic cup. Nevertheless, few population-based studies have assessed the distribution of CDR and factors that may influence this value. In addition, the results of some studies remain controversial. The Blue Mountains Eye Study [2] and the Barbados Eye Study [3] noted increase in mean CDR with age, whereas the Baltimore Eye Study [1], the Rotterdam Study [4], and the Vellore Eye Study [5] did not. With respect to sex, several studies have reported conflicting results. The Singapore Malay Eye Study [6] and Quigley et al. [7] reported that males had larger CDR than females, but the Baltimore Eye Study [1], the Vellore Eye Study [5], and the Rotterdam Study [4] did not find a significant relationship between sex and vertical CDR.
The purpose of this study was to investigate the distribution of vertical CDR and the relationship of vertical CDR to age, sex, and other demographic and health characteristics in the healthy Korean population.
Materials and Methods
Study population
The Korea National Health and Nutrition Examination Survey (KNHANES) is a nationwide, population-based, cross-sectional health examination and survey conducted regularly by the Division of Chronic Disease Surveillance, Korea Centers for Disease Control and Prevention, Ministry of Health and Welfare, to monitor the general health and nutritional status of people in South Korea. To date, the KNHANES has been performed in 1998 (KNHANES I), 2001 (KNHANES II), 2005 (KNHANES III), 2007 to 2009 (KNHANES IV), and 2010 to 2012 (KNHANES V). It consists of a health interview survey, a nutrition survey, and a health examination survey. A stratified, multistage probability sampling design is used to select household units to participate in the survey. The survey adheres to the principles outlined in the Declaration of Helsinki for human research, and all participants provide written informed consent. The study protocol was approved by the institutional review board of Samsung Medical Center.
This study was retrospective and population-based, and included 28,377 participants age 19 years and older. All data were obtained from the fourth (KNHANES IV-2&3, 2008, 2009) and fifth (KNHANES V 1&2, 2010, 2011) KNHANES.
Measurements
All participants underwent personal medical interviews and ophthalmological examinations as part of the KNHANES process. We analyzed vertical CDR as an outcome variable, and independent variables included health behavior factors, demographic factors, and health examination factors. The health behavior factors included alcohol use, smoking status, diabetes mellitus, and hypertension, while age and sex were included as demographic factors. The health examination factors included systolic and diastolic blood pressure, height, weight, body mass index (BMI), fasting plasma glucose, hemoglobin A1c, total cholesterol, intraocular pressure (IOP), and refractive error.
Alcohol use was defined as drinking more than one glass of alcohol in a sitting at least once a month. Ever smokers were defined as having smoked more than 100 cigarettes during their lifetime, according to the World Health Organization [8]. We defined subjects with diabetes as those whose fasting serum glucose levels were 126 mg/dL or higher, those taking glucose lowering medication, or those diagnosed with diabetes by a physician. We defined subjects with hypertension as those with a mean systolic blood pressure of Ōēź140 mmHg or with a mean diastolic blood pressure (DBP) of Ōēź90 mmHg, or those who were taking antihypertensive medication. Blood pressure was measured three times by trained assistants during the survey and average values were used for analysis.
Height and weight were measured to the nearest 0.1 cm and 0.1 kg with the participants wearing light indoor clothing. BMI was calculated as weight (kg) divided by squared height (m2). After 12 hour of overnight fasting, blood samples were obtained from the antecubital veins of the study subjects. Fasting plasma glucose and total cholesterol were measured using a Hitachi 7600-110 chemistry analyzer (Hitachi, Tokyo, Japan).
The full ophthalmologic examination included auto-refraction, slit-lamp examination of the anterior segment of the eye, IOP measurements, and fundus photography. Refraction measurements were performed using an autorefractor-keratometer (KR 8800; Topcon, Tokyo, Japan) and were converted into spherical equivalents and calculated as the spherical value plus half the astigmatic value. A spherical equivalent between -0.5 diopters (D) and +0.5 D was defined as emmetropia, less than -0.5 D as myopia, and greater than +0.5 D as hyperopia. The depth of the anterior chamber was evaluated by the Van Herick method using slit lamp examination (Haag-Streit model BQ-900; Haag-Streit AG, Koeniz, Switzerland). IOP was measured with a Goldmann applanation tonometer (Haag-Streit model BQ-900; Haag-Streit AG, Koeniz, Switzerland). Digital fundus images were taken with a digital non-mydriatic fundus camera (TRC-NW6S, Topcon).
Visual-field testing was performed with frequency-doubling technology (FDT; Humphrey Matrix, Carl Zeiss Meditec, Dublin, CA, USA) using the N-30-1 screening test. The test location was deemed abnormal if it was not identified on two attempts at a contrast level identified by 99% of the healthy population.
If the participants had elevated IOP of Ōēź22 mmHg or glaucomatous optic disc (horizontal or vertical cup-to-disc ratio Ōēź0.5; violation of the inferior > superior > nasal > temporal (ISNT) rule [a neuroretinal rim thickness order of inferior > superior > nasal > temporal]; presence of optic disc hemorrhage; or presence of a retinal nerve fiber layer defect), frequency doubling perimetry testing (FDT) was carried out with the screening program N-30-1.
All fundus photographs were assessed for severity of diabetic retinopathy. The presences of microaneurysms, dot hemorrhages, hard exudates, cotton wool spots, venous loops or beading, clinically significant macular edema, neovascularization, vitreous or retinal hemorrhage, fibrous proliferation, tractional retinal detachment, and previous laser treatment were evaluated. Additionally, the photographs were assessed for age-related macular degeneration (AMD) as indicated by the presence of drusen, retinal pigment epithelium (RPE) hyperpigmentation or depigmentation, exudative AMD-RPE detachment, serous detachment of the sensory retina, subretinal or sub-RPE hemorrhages, subretinal fibrous scarring, geographic atrophy, and disciform scarring. We excluded participants with evidence of diabetic retinopathy or AMD.
Definitions of glaucoma and non-glaucoma subjects
Glaucoma was diagnosed using the International Society of Geographic and Epidemiological Ophthalmology classification [9]. Patients were defined as having open-angle glaucoma when any one of the following category I or category II diagnostic criteria were met.
Category I criteria: The presence of FDT testing results and fixation error and false-positive error Ōēż1; (1) loss of neuroretinal rim with vertical or horizontal CDR Ōēź0.7, or asymmetry of vertical CDR Ōēź0.2 (both values determined by Ōēź97.5th percentile for the normal population in the KNHANES), or the presence of optic disc hemorrhage or the presence of retinal nerve fiber layer defect; and (2) the presence of an abnormal FDT testing result (at least one location of reduced sensitivity).
Category II criteria: The absence of FDT testing results or fixation error or false-positive error Ōēź2; (1) loss of neuroretinal rim with vertical CDR Ōēź0.9 or asymmetry of vertical CDR Ōēź0.3 (both values determined by Ōēź99.5th percentile for the normal population in the KNHANES); or (2) the presence of retinal nerve fiber layer defect with violation of the ISNT rule (a neuroretinal rim thickness order of inferior > superior > nasal > temporal).
Non-glaucomatous subjects who met all of the following criteria in both eyes were included: (1) IOP Ōēź5 mmHg and Ōēż30 mmHg; (2) the presence of an open angle (peripheral anterior chamber depth >1/4 corneal thickness); (3) non-glaucomatous optic disc (inter-eye difference of vertical and horizontal CDR <0.2); (4) absence of optic disc hemorrhage or retinal nerve fiber layer defect; and (5) optic disc satisfying the ISNT rule. Only one eye from each subject was used for statistical analyses. Glaucoma specialists on the regular ad hoc committee for glaucoma diagnosis at our institution diagnosed open-angle glaucoma through reviews of the all fundus images and visual field tests.
Statistical analysis
Statistical analysis was performed using a statistical software program (PASW Statistics ver. 18.0; SPSS Inc., Chicago, IL, USA). Mean vertical CDR for both eyes was 0.34 ┬▒ 0.12 (p = 0.218). Additionally, the vertical CDR in right eyes was correlated with that of left eyes (r = 0.825, p < 0.001). Therefore, we analyzed only data from right eyes in our assessment.
A one-way analysis of variance model was used to compare mean vertical CDRs for each age group. Student's t-tests were performed to confirm statistical differences in mean vertical CDRs of males and females in each age group. Analysis of covariance models were used to estimate the differences in mean vertical CDR of each quartile of systemic predictors, which were adjusted for age and sex. Multiple linear regression models were used to assess independent associations between CDR and risk factors.
Results
Of 28,377 participants who were over 19 years old, 20,728 participants underwent examinations with digital non-mydriatic fundus cameras. A total of 19,258 participants had CDR results for both eyes and were eligible for the study after excluding participants who had evidence of diabetic retinopathy or AMD on their fundus photographs. Finally, 17,767 participants who met the criteria of non-glaucomatous subjects were enrolled in this study, after excluding patients who met the criteria for glaucoma according to the International Society of Geographic and Epidemiological Ophthalmology classification [9].
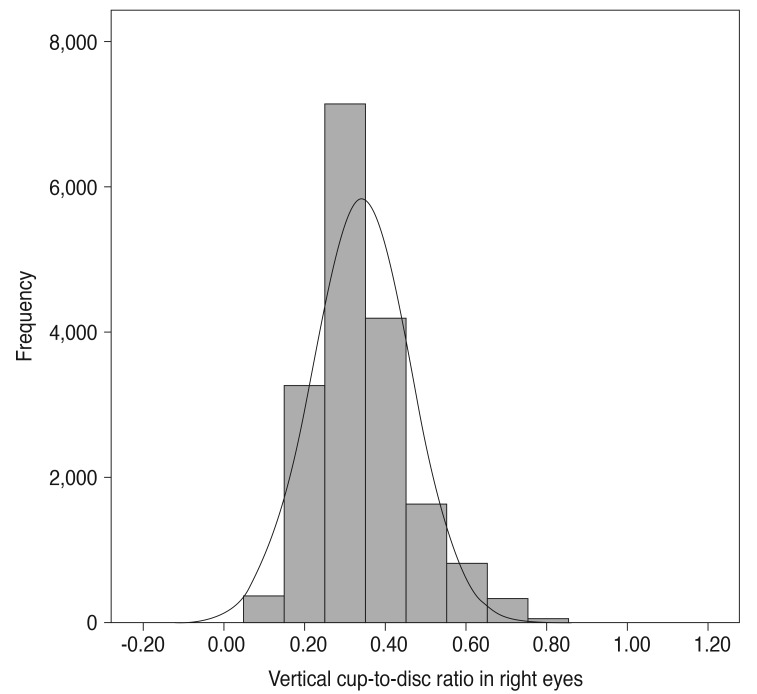
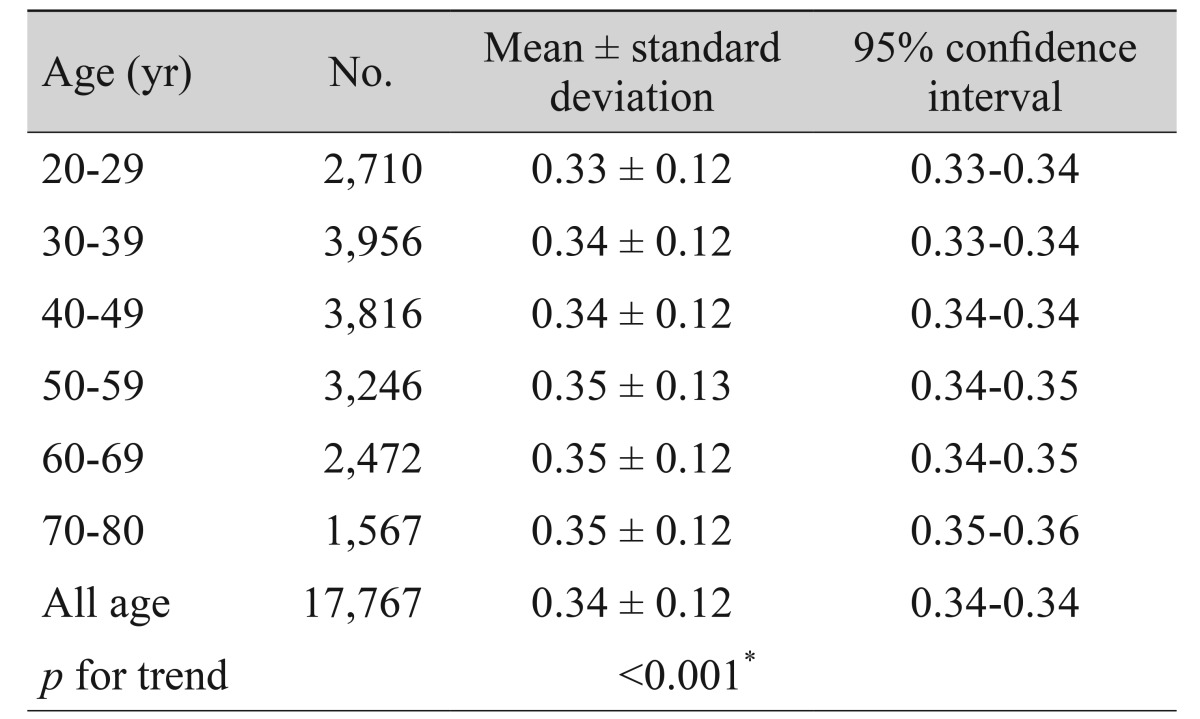
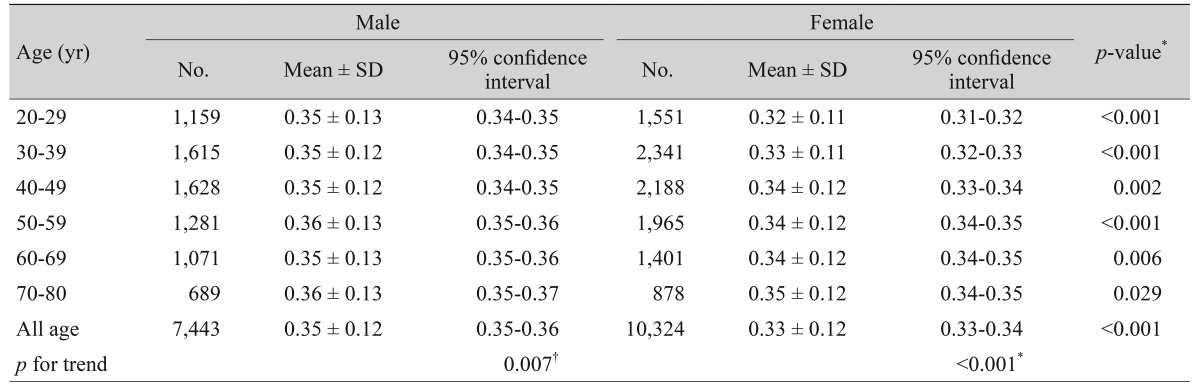
The mean age of participants was 46.4 ┬▒ 15.3 years, and the mean vertical CDR in right eyes was 0.34 ┬▒ 0.12, which was the same as that in left eyes. Fig. 1 shows the distribution of vertical CDR in right eyes. Table 1 shows the mean vertical CDR by age group from 20s to 70s, with values increasing with age (p for trend <0.001). Table 2 provides the distribution of mean vertical CDRs by age group and sex, and the mean vertical CDR of males and females also increased with age (males, p for trend = 0.007; females, p for trend <0.001). The mean vertical CDR of male subjects (n = 7,443) was 0.35 ┬▒ 0.12 and that of female subjects (n = 10,324) was 0.33 ┬▒ 0.12, with the vertical CDR in males being significantly greater than in females (p < 0.001). In each age group, the vertical CDR of males was greater than that of females.
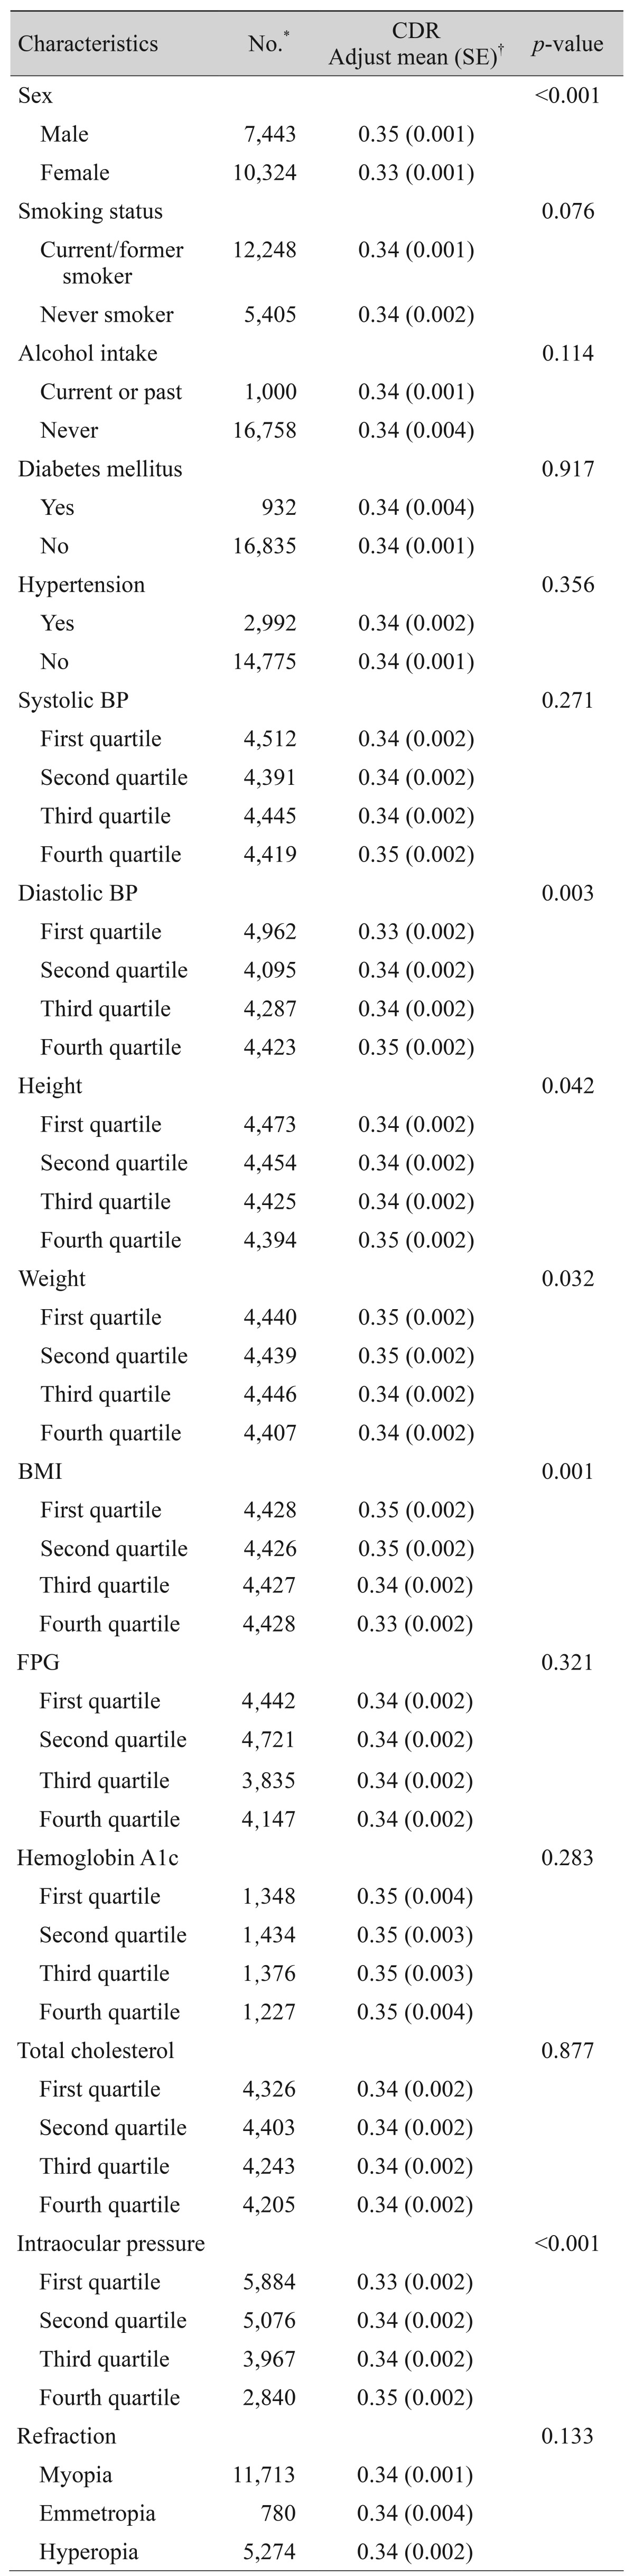
Relationships between systemic and ocular predictors with vertical CDR in the study population (n = 17,767) were investigated through an analysis of covariance model that controlled for age and sex (Table 3). The mean vertical CDR was greater in males than in females after adjusting for age (p < 0.001). Smoking status, alcohol intake, diabetes mellitus, hypertension, systolic blood pressure, fasting plasma glucose, hemoglobin A1c, total cholesterol, and refractive errors were not associated with vertical CDR. Higher DBP (p = 0.003), height (p = 0.042), and IOP (p < 0.001) were associated with a greater vertical CDR. On the contrary, lower weight (p = 0.032) and BMI (p = 0.001) were associated with a greater vertical CDR.
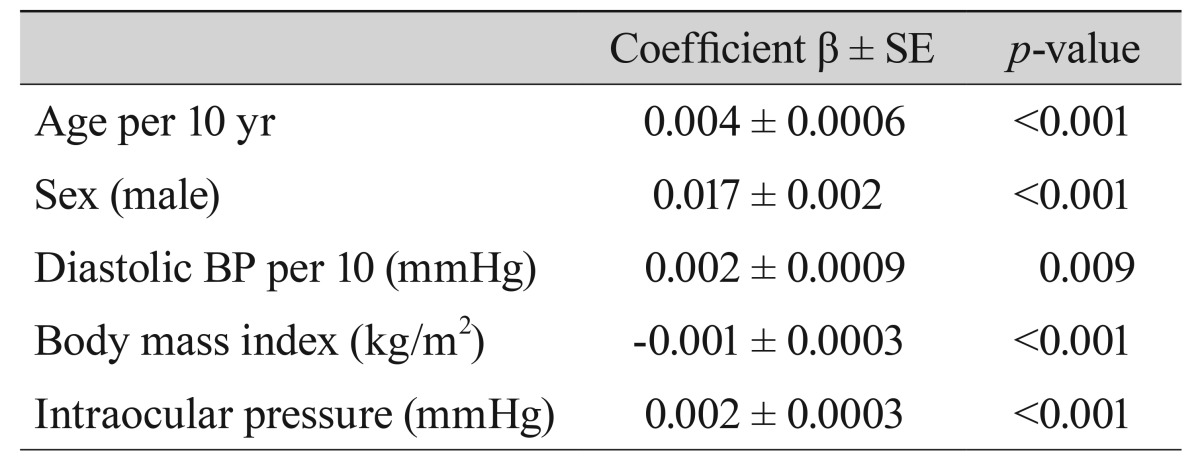
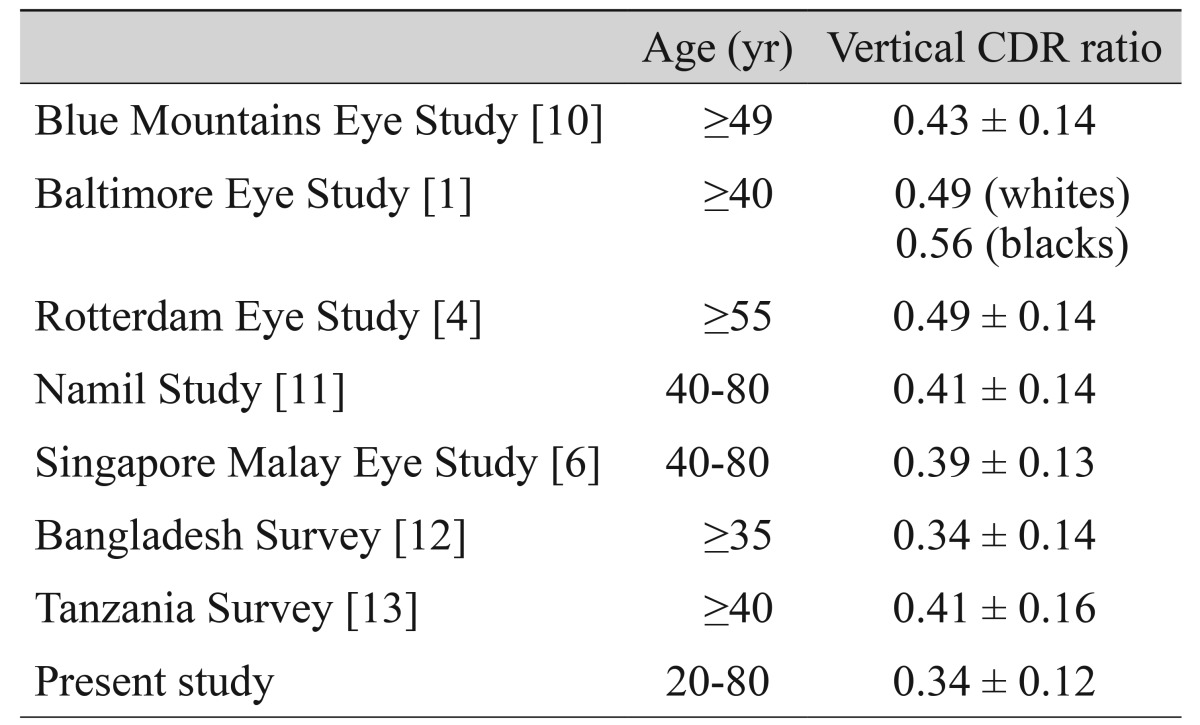
Table 4 shows relationships between vertical CDR and systemic factors on multiple linear regression analysis in the study population. In non-glaucomatous subjects, significant independent determinants of greater vertical CDR were increasing age (p < 0.001), male sex (p < 0.001), higher DBP (p = 0.009), lower BMI (p < 0.001), and higher IOP ( p < 0.001). The results of other CDR studies are summarized in Table 5 [1,4,6,10,11,12,13].
Discussion
In this study, the mean vertical CDR of non-glaucomatous subjects was 0.34 ┬▒ 0.12. Compared with results from other studies, the mean vertical CDR tended to be smaller. Possible reasons for these differences may have differences in the age ranges of the study samples, and that some other studies included subjects with glaucoma. Furthermore, the methods used to measure CDR in each study were different. Nevertheless, the mean vertical CDR in our study was relatively small, perhaps due to age, ethnicity, race, or exclusion of glaucoma subjects.
We found that vertical CDR increased significantly between the ages of 20 and 80 years. Each subsequent decade was associated with a 0.4% increase in mean vertical CDR on multiple linear regression analysis. The Blue Mountains Eye Study [2] and Garway-Heath et al. [14] reported similar results. In the Blue Mountains Eye Study [2], each decade of increased age was associated with a 1.4% increase in mean CDR after excluding patients with glaucoma or known optic disc disease. Garway-Heath et al. [14] also showed that mean CDR increased by approximately 0.1 between ages 30 and 70 years. However, the Rotterdam Study [4] and the Singapore Malay Eye Study [6] reported that age was not a significant determinant of CDR in non-glaucomatous subjects. Despite these conflicting results, Balazsi et al. [15], Mikelberg et al. [16], Jonas et al. [17] and Jonas et al. [18] reported that ganglion cell nerve fibers diminished with increasing age in histologic studies. This finding may suggest a future direction for further research.
Male sex was a significant determinant of CDR in this study. The mean vertical CDR of males was greater than that of females, and this association remained significant after adjusting for age. This was in concordance with the Singapore Malay Eye Study [6] and Quigley et al. [7], but was in contrast with the results of the Rotterdam Study [4] and the Vellore Eye Study [5]. To determine the exact impact of gender on CDR, further studies are necessary.
We found that higher DBP was associated with greater vertical CDR, but the Singapore Malay Eye Study [6] reported contrasting results. Generally, ischemic changes in the optic nerve may be a risk factor for optic nerve damage, but many studies have noted conflicting results regarding blood pressure and CDR. Therefore, we need to consider factors that can affect ischemic changes in the optic nerve such as blood pressure, IOP, f luctuation of diurnal IOP, cholesterol, and other factors. Deokule and Weinreb [19] reported that the higher the blood pressure, the higher the prevalence of open-angle glaucoma. However, Tielsch et al. [20] noted that hypertension was not a risk factor for open-angle glaucoma. In the Barbados Eye Study [3], low DBP was associated with risk of open-angle glaucoma. According to Costa et al. [21], both systemic hypertension and hypotension as well as the diurnal f luctuations in blood pressure could, through different mechanisms, be risk factors for glaucoma. They also proposed that the balance between IOP and blood pressure, and the ability to deal with an eventual unbalance, are potential factors in the development of glaucoma [21].
In the present study, greater height and lower weight and BMI were associated with greater vertical CDR. Independent of IOP, age, and sex, lower BMI was associated with greater vertical CDR on multiple linear regression analysis. These results were similar to those of the Singapore Malay Eye Study [6]. The Barbados Eye Study [3] showed that a higher BMI had some protective effects on the risk of open-angle glaucoma, and Gasser et al. [22] reported a tendency for glaucoma patients to have a lower BMI than controls. Zheng et al. [23] also reported that greater height and lower weight and BMI were significantly related to a thinner neuroretinal rim of the optic disc and larger CDR. However, the underlying mechanism explaining this relationship is still unclear. The results of several studies [24,25,26] in which higher body weight and BMI were associated with higher IOP indicates that the association between lower BMI and greater vertical CDR may not be mediated by IOP. Therefore, further evaluation of this relationship is needed.
Clinically, myopia may be associated with large disc and large CDR. However, in this study, we observed no significant differences among patients with myopia, emmetropia, and hyperopia, perhaps because we excluded subjects with glaucoma. The Singapore Malay Eye Study [6] also showed similar results, while Kim et al. [27] noted that CDR was not correlated with axial length in normal subjects. Jonas et al. [28] and Wang et al. [29] reported that optic disc size was correlated with myopic refractive error. However, the refractive errors of subjects examined by Jonas et al. [28] were less than -8.0 D, and Wang et al. [29] noted that optic disc area was significantly larger in highly myopic eyes than in the remaining eyes in their sample, with refractive error ranging between -8 and +4 D. In our study, there were 257 myopic subjects with error less than -8.0 D (1.4%) and we also excluded glaucoma patients. So each group may have no distinct results of CDR.
The Blue Mountains Eye Study [2] found that the CDR increased by 0.04 for every 10 mmHg increase in IOP. In the Baltimore Eye Study [1] and the Singapore Malay Eye Study [6], the higher the IOP, the greater the CDR. The Beaver Dam Eye Study [30] also reported that changes in CDR were associated with changes in IOP. In our study, we found that for every 10 mmHg increase in IOP, the vertical CDR increased by 0.02, which is consistent with the results of previous studies.
The major limitation of this study is that we did not measure optic disc size. In the Vellore Eye Study [5] and the Blue Mountains Eye Study [10], the optic disc and cup diameters were highly variable among individuals and could have affected the CDR. If optic disc size is taken into account, the ability to diagnose glaucoma increases. However, previous studies [5,10] showed that larger optic disc size was correlated with larger optic disc cups, and these results support the value of the current study. The second limitation is that the assessment of the CDR was performed by many different ophthalmologists, and reproducibility among observers was not evaluated. Assessments of the optic disc and cup during the evaluation of myopic or tilted discs may have been inaccurate because of dependence on subjective assessment. However, considering the large study population and use of glaucoma specialists to make the diagnosis, the effect of random error is likely to be minimal. Finally, in this study we utilized a cross-sectional design.
In conclusion, significant determinants of greater vertical CDR were older age, male sex, higher DBP, lower BMI, and higher IOP. Although these factors were all statistically significant, it is important to consider clinical aspects of associations of the determinants with CDR. Further longitudinal studies of additional factors and their relationships to age are needed.
 PDF Links
 PubReader
 Full text via DOI
 Full text via PMC
 Download Citation
 Print
Print


