

Optical coherence tomography (OCT) is a method of acquiring and processing optical signals that is known to have excellent reproducibility and therefore plays an important role in the detection and monitoring of glaucoma and retinal disease [1-3]. As with other imaging modalities, the quality of OCT images is essential to clinical analysis. Signal strength (SS) and the placement of an exact center are used as criteria to assess the quality of an OCT image. In previous versions of OCT software, the signal to noise ratio (SNR) was the only parameter for quality. The SNR parameter gave only a general indication of the strength of the acquired signal within a given scan. In current OCT software, SS is used for image quality control. Signal strength is an advanced parameter that combines SNR and the uniformity of the signal within a scan. The scale of SS ranges from 1 to 10, with 1 representing poor image quality and 10 representing excellent image quality [4]. According to current manufacturer recommendations, SS of 6 or greater is significant for meaningful analysis.
A number of factors, including pupil size, lens opacity and corneal drying, have been reported to influence the SS and the measurement of retinal nerve fiber layer (RNFL) thickness in patients [4-9]. These factors cannot be corrected in some patients, and can compromise the image quality of OCT scans. When an image has low SS due to the above factors, other tools can be used to diagnose glaucoma for patient care. Examples of other diagnostic tools include the Humphrey visual field analyzer and fundus photography. These tools, however, also have low reliability in many cases. For situations of low image reliability due to uncorrectable patient factors, reference data for OCT is not yet published. Recently, advanced OCT has been developed that offers improved visual quality [10]. Because the Stratus OCT is still widely used, however, information for more accurate interpretation of OCT images is needed [11]. In an effort to help improve interpretation of OCT images, this study investigates the variability of OCT scans by varying SS, a critical parameter for the quality of scans.
Materials and Methods
This cross-sectional, observational study was done from December 2007 to August 2008 after approval from the institutional review board and ethics committee of the Kangbuk Samsung Hospital in Seoul, Korea. This prospective study was performed after approval from the subjects were recruited from the outpatient glaucoma service of the Kangbuk Samsung Hospital. This study evaluated 688 eyes in 688 participants. All of the subjects underwent a full medical and ocular history. The detailed ocular examination included visual acuity, intraocular pressure measurement using the Goldman applanation tonometer, and slit lamp and fundus examinations. A digital fundus camera was used to take red-free fundus photographs of the retina and stereo disc photographs (Visucam; Carl Zeiss Meditec, Dublin, CA, USA). Detailed fundus examination and OCT scans were performed under mydriasis. In addition, other basic ocular exams were performed without the participants being under mydriasis.
The study classified participants as normal if they met the extensive criteria of having a highest documented IOP of 20 mmHg bilaterally, normal bilateral examination findings - including fundus examination under mydriasis, normal bilateral visual field results defined as mean deviation within 95% of normal limits, and glaucoma hemifield test results within 99% of normal limits. Included among subjects with glaucoma were those with diagnoses of open angle glaucoma defined as optic disc abnormalities, and RNFL defects with or without visual field loss. Glaucomatous optic disc abnormality was defined as having one of several features, including neuroretinal rim thinning, notching, or excavation. Optic disc abnormalities were detected in the stereo disc photographs. Defects of the RNFL were detected in the red-free digital fundus photographs. Other inclusion criteria for both normal and glaucomatous subjects were, 1) the subject was 18 years or older, 2) the subject had best-corrected visual acuity of 20 / 40 or better, 3) the subject had no history of ocular or neurological disease or surgery that might produce test results or vision changes confounding recognition of test results due solely to glaucoma, 4) the subject had no history of amblyopia, 5) the subject had the mental and physical capacity to perform the tests, and 6) willingness to participate as a subject in the study.
Optic coherence tomography technique
Twice in the same day, subjects were scanned with the Stratus OCT (software ver. 4.0.1, Carl Zeiss Meditec). The OCT scans were performed on each subject by a single technician through a dilated pupil with Fast RNFL thickness protocols using internal fixation. An operator applied artificial tears (Hyalein; Santen Pharmaceuticals, Osaka, Japan) to each patient before scanning. A scan was successfully obtained if the fundus image was sufficiently visible to distinguish the optic disc and the scanning circle, and if there were no obvious movement artifacts with missing data at the acquired scan pattern. Images with poor scan quality (error messages and obvious segmentation errors), decentration, poor focus or low analysis confidence were excluded. For subjects who had both eyes scanned, one eye was randomly selected for analysis. In addition, cases having the same signal strength in repeated OCT scans were selected for analysis. When the signal strength was different in repeated OCT scans despite the scans being of good quality, we evaluated one additional OCT scan and selected scans with the same signal strength for analysis. Cases with different signal strength among three OCT scans were excluded from analysis. The RNFL thickness measurements from initial and repeat scans were compared and subsequently correlated with the differences in SS.
The analysis algorithm reports 17 RNFL thickness values, as follows. Mean RNFL thickness around the entire circumference, average thickness within the four quadrants (temporal, superior, nasal, and inferior), and average thickness in each of 12 clock-hour sectors, where clock hours 1 to 5 represent the nasal clock hours, and clock hours 7 to 11 represent the temporal ones. Left optic disc areas were considered to be the mirror images of right optic disc areas. In all tables, the measured areas of the nasal region were named clockwise from 12 to 6. The measured areas of the temporal region were named from 6 to 12.
Statistical analysis
Statistical analyses were performed using PASW statistics ver. 17.0 (SPSS Inc., Chicago, IL, USA). Parameters, including average RNFL thickness and mean clock hour RNFL thicknesses, were automatically generated in the analysis report. These measurements were aligned based on right eye orientation. The superior clock hour was designated as 12 o'clock, and the others were assigned accordingly. The clock hours were assigned clockwise in the right eye and counterclockwise in the left eye. The four quadrants, clock hours, and average RNFL measurements obtained at different SS were compared with repeated-measures of ANOVA. Spearman's correlation coefficient was used to identify statistically significant correlations. The false positive ratio was defined as values below the fifth percentile of RNFL thickness for normal eyes. The false positive ratio was analyzed to compare diagnostic ability according to varying SS. The value of p < 0.05 was considered statistically significant.
Results
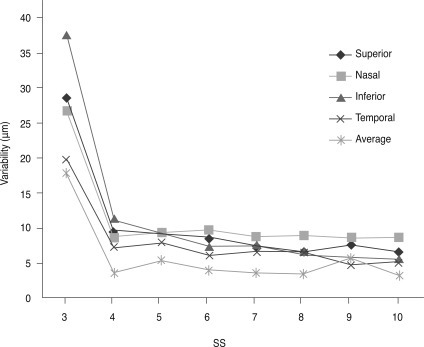
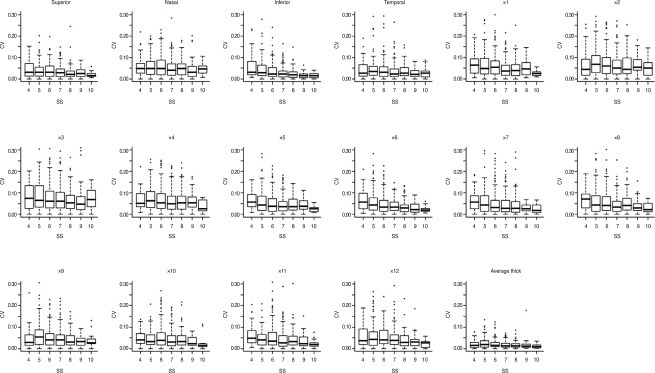
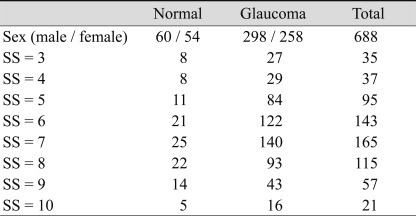
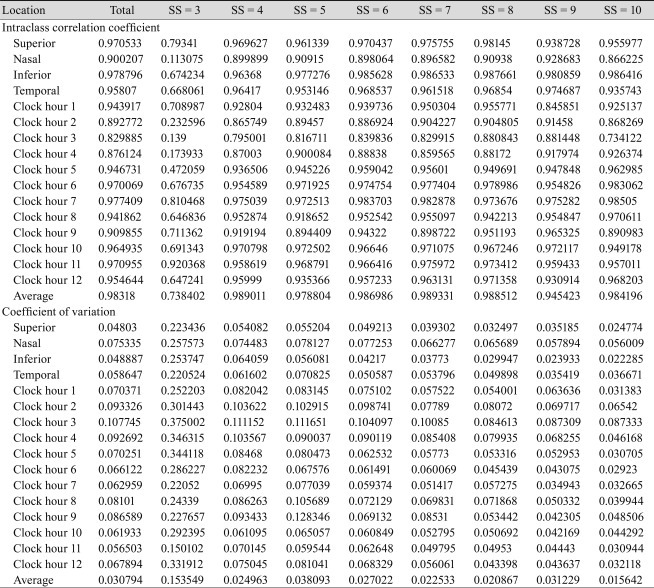
We analyzed 668 eyes of 668 total subjects. The demographic and ophthalmic characteristics of all included subjects are shown in Table 1. The intraclass correlation coefficient and variability (standard deviation) of all included subjects are shown in Table 2. The variability of RNFL thickness by SS is shown in Fig. 1. When SS was 3, the variability of RNFL thickness significantly increased, as opposed to when signal strength was 4 or greater. Correlations between SS and variability in average RNFL thickness, RNFL thickness of the four quadrants, and the 12 o'clock hour RNFL thickness are shown in Fig. 2. Significant correlations were observed between SS and variability in average RNFL thickness, RNFL thickness of the four quadrants, and the 12 o'clock hour RNFL thickness. Significant negative correlations were observed between variability in RNFL thickness and signal strength, which indicates that a decrease in the SS value is associated with increased variability in RNFL thickness. Furthermore, when SS was 3, the variability in RNFL thickness significantly increased, as opposed to when SS was 4 or greater.
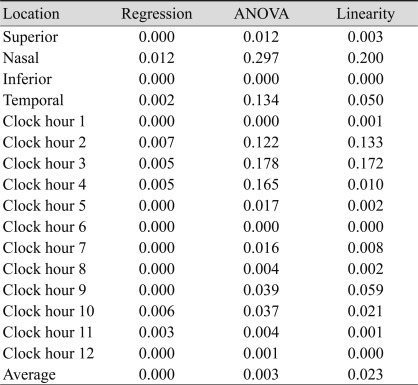
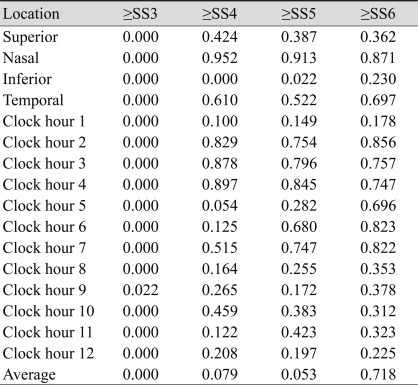
Multivariate regression analysis was performed using SS as an independent variable. Dependent variables were the variability in average RNFL thickness, the RNFL thickness of four quadrants, and 12 o'clock hour RNFL thickness (Table 3). SS was an independent predictor for variability in the average RNFL thickness, superior quadrant RNFL thickness, and inferior quadrant RNFL thickness. SS was also an independent predictor for variability in the 1 o'clock hour RNFL thickness and in the RNFL thicknesses from the hours of 5 to 12 o'clock. Table 4 shows the significance of difference as measured by varying SS. The variability of SS 4 and 5 were significant only in the inferior quadrant. The false positive ratio decreased as SS increased. The false positive ratio was 28% when SS was 4, and it was 19.1% when SS was 6. When SS was 6 or greater, the false positive ratio was 16.4%.
Discussion
An important finding of this study is that when signal strength increased, variability decreased significantly (Fig. 2). The method of test-retest is very good for investigating the reproducibility of a device because the method systematically maintains the same environment, same time, and same technician. The results show that when signal strength is 3, the variability is too high for accuracy or reliability (Fig. 1). When signal strength is 4 or greater, the variability decreases significantly. By the time that signal strength reaches 6 or greater, variability is quite small. In our analysis, the difference of variability of average RNFL thickness between signal strength 4 (4.94 µm) and signal strength 6 (4.41 µm) was 0.53 µm. The variation between signal strength 4 and signal strength 7 (3.49 µm) was 1.45 µm. Clinically, this variation is insignificant with regard to the reproducibility of OCT. Test-retest reliability as low as 3.5 microns has been reported in normal patients [8].
Glaucoma is an optic neuropathy characterized by retinal ganglion cell death and corresponding nerve fiber layer loss. This significant structural damage in the RNFL may precede visual field loss [12]. To estimate the extent of the damage and evaluate the rate of disease progression, it is important to understand the relationship between structural injury and functional loss. Accordingly, some studies are being conducted to look into the relationship [13]. One of the most useful technologies for the structural evaluation of glaucomatous damage is OCT [14]. In comparison to other diagnostic technologies, OCT offers less variability in determinations of RNFL thickness [1]. But in some cases, glaucomatous RNFL defects identified in Stratus OCT images are classified as normal [15].
Several studies have postulated that signal strength is related to the value of RNFL thickness as determined by OCT imaging. When SS is low, RNFL thickness measures are consistently thinner [9]. If SS impacts diagnostic accuracy, false positives may increase in cases where low SS is imperative due to uncorrectable patient factors. In light of this point, this research compares the false positive ratio according to varying SS. The false positive ratio decreases as SS increases. According to our results, OCT imaging lacks reliable diagnostic ability in low SS 4. Because the detection of progression is essential for the diagnosis of glaucoma, however, image reproducibility is a very important factor for patient care. At the low level of SS 4, watching the turn of progression may help to detect glaucoma.
The incidence of glaucoma increases with age, and the disease occurs most frequently in patients over 40 years of age. Ten percent of people over 80 years of age have glaucoma [16]. The incidence of cataracts, vitreous opacity, and corneal opacity increase with age as well. Many OCT images of elderly glaucoma patients show low signal strength and low image accuracy. Moreover, poor images are more frequently acquired from advanced glaucomatous eyes than from other groups. This is likely because RNFL is thinner and has lower internal reflectivity as a result of glaucomatous damage in the eyes of patients with advanced retinal disease. Results are not reliable because of the low signal strength in these cases, however, even though OCT images are measured with accurate centering. Furthermore, there are no guidelines for interpretation when OCT images show low signal intensity.
Signal strength is an important parameter for OCT image analysis. Some studies select images for analysis only when the signal strength is at least 8 [17,18], while other studies consider a signal strength of 5 to be of good image quality for analysis [19,20]. Signal strengths of 6 [21-23] and 7 [24-26] have also been used as the minimal inclusion criteria in various studies. Although signal strength is a useful index of OCT image quality, opinions vary on the level of signal strength required for good quality images. Regardless, there is no recommendation on a minimal acceptance value of signal strength in poor quality scans.
A study by Wu et al. [27] has suggested that, when measuring RNFL thickness with the Stratus OCT, it is important to aim for a signal strength of at least 7. In the current study's cases that show signal strengths of 3 or 4, the subjects have cataracts, vitreous opacity, and/or senile corneal opacity. Some cases of low signal strength show only senile media opacity. The current study used clinical techniques of mydriatics and artificial tears to improve the signal strength for analysis. Regardless, among this patient population, it is often difficult to improve the quality of images with clinical techniques. Therefore, the field of OCT needs another way to solve the problem of poor imaging due to uncorrectable patient factors. Accordingly, this study aims to determine the minimal acceptance level of signal strength for poor quality scans.
Ordinarily, obtaining the highest possible signal strength is imperative for good clinical analysis. Even small differences can be significant, particularly in patients with moderate to advanced glaucomatous optic nerve damage and markedly reduced RNFL. In a scan with higher signal strength, light penetrates deeper into the retina, which increases the reflectivity of all layers and results in more retinal tissue having higher reflectivity than the quality threshold defined by OCT [27]. In cases where low signal strength is an unavoidable consequence of certain patient factors, the low signal strength compromises image quality. Specifically, scans with lower signal strengths tend to underestimate the thickness of the RNFL. This variability is especially pronounced in patients with advanced optic nerve damage, even in scans without explicit error messages [28]. One study has shown RNFL thickness measurements that are more variable among glaucoma patients than normal subjects (13.8 microns) [8]. Accordingly, it is important to obtain scans of equal and high signal strengths to facilitate the longitudinal follow-up for treatment of glaucoma. The results of the current study show that high SS (above 6) is recommendable. However, when signal strength is low due to uncorrectable patient factors - despite clinical efforts to maximize signal strength - our results suggest that signal strength of 4 is acceptable to obtain reproducible scanning images among patients with ocular media opacities. Our results offer a standard reference for analysis of OCT results in patients with ocular media opacities when SS is below 6 despite the correction of all modifiable factors with clinical techniques. Establishing a common low limit of acceptable signal strength may make our results more broadly applicable in clinical settings. Regardless of whether or not our results are applicable to establishing new standards for spectral domain OCT, because the Stratus OCT is used all over the world, the findings of this study are useful for diagnosis and follow-up treatment of glaucoma.
 PDF Links
 PubReader
 Full text via DOI
 Full text via PMC
 Download Citation
 Print
Print


